Tohono O'odham vs Swiss Householder Income Under 25 years
COMPARE
Tohono O'odham
Swiss
Householder Income Under 25 years
Householder Income Under 25 years Comparison
Tohono O'odham
Swiss
$45,248
HOUSEHOLDER INCOME UNDER 25 YEARS
0.0/ 100
METRIC RATING
336th/ 347
METRIC RANK
$51,493
HOUSEHOLDER INCOME UNDER 25 YEARS
15.4/ 100
METRIC RATING
199th/ 347
METRIC RANK
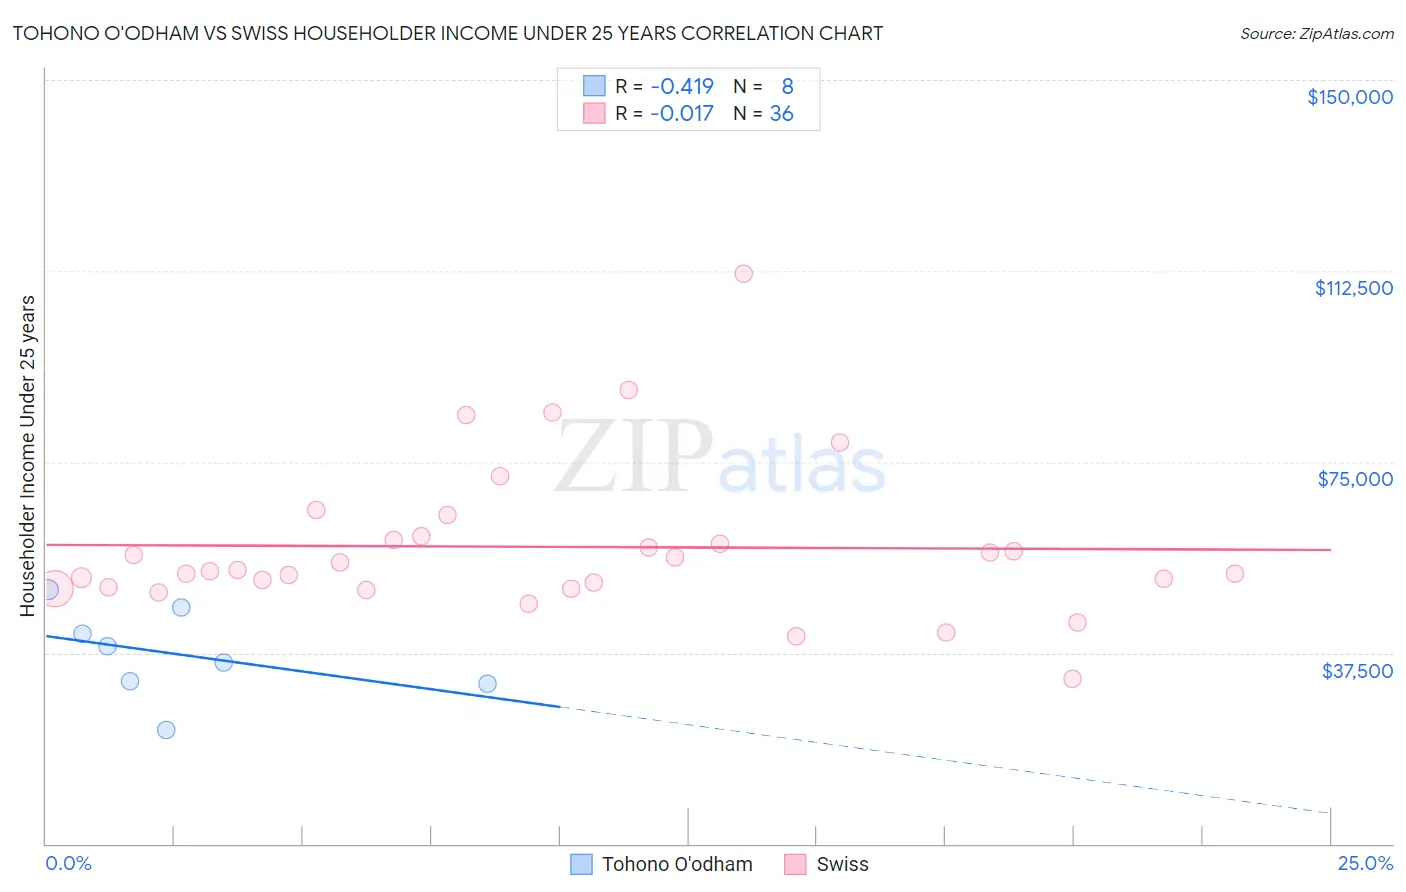
Tohono O'odham vs Swiss Householder Income Under 25 years Correlation Chart
The statistical analysis conducted on geographies consisting of 56,811,547 people shows a moderate negative correlation between the proportion of Tohono O'odham and household income with householder under the age of 25 in the United States with a correlation coefficient (R) of -0.419 and weighted average of $45,248. Similarly, the statistical analysis conducted on geographies consisting of 379,774,571 people shows no correlation between the proportion of Swiss and household income with householder under the age of 25 in the United States with a correlation coefficient (R) of -0.017 and weighted average of $51,493, a difference of 13.8%.
Householder Income Under 25 years Correlation Summary
| Measurement | Tohono O'odham | Swiss |
| Minimum | $22,412 | $32,411 |
| Maximum | $49,920 | $111,905 |
| Range | $27,507 | $79,494 |
| Mean | $37,222 | $58,319 |
| Median | $37,258 | $53,662 |
| Interquartile 25% (IQ1) | $31,632 | $50,296 |
| Interquartile 75% (IQ3) | $43,831 | $60,032 |
| Interquartile Range (IQR) | $12,199 | $9,736 |
| Standard Deviation (Sample) | $8,859 | $15,271 |
| Standard Deviation (Population) | $8,287 | $15,058 |
Similar Demographics by Householder Income Under 25 years
Demographics Similar to Tohono O'odham by Householder Income Under 25 years
In terms of householder income under 25 years, the demographic groups most similar to Tohono O'odham are Cheyenne ($45,275, a difference of 0.060%), Cajun ($45,338, a difference of 0.20%), Creek ($45,371, a difference of 0.27%), Choctaw ($45,450, a difference of 0.45%), and Pueblo ($45,018, a difference of 0.51%).
| Demographics | Rating | Rank | Householder Income Under 25 years |
| Seminole | 0.0 /100 | #329 | Tragic $45,649 |
| Indonesians | 0.0 /100 | #330 | Tragic $45,566 |
| Immigrants | Zaire | 0.0 /100 | #331 | Tragic $45,529 |
| Choctaw | 0.0 /100 | #332 | Tragic $45,450 |
| Creek | 0.0 /100 | #333 | Tragic $45,371 |
| Cajuns | 0.0 /100 | #334 | Tragic $45,338 |
| Cheyenne | 0.0 /100 | #335 | Tragic $45,275 |
| Tohono O'odham | 0.0 /100 | #336 | Tragic $45,248 |
| Pueblo | 0.0 /100 | #337 | Tragic $45,018 |
| Chickasaw | 0.0 /100 | #338 | Tragic $44,763 |
| Kiowa | 0.0 /100 | #339 | Tragic $44,733 |
| Blacks/African Americans | 0.0 /100 | #340 | Tragic $44,381 |
| Houma | 0.0 /100 | #341 | Tragic $44,356 |
| Arapaho | 0.0 /100 | #342 | Tragic $44,003 |
| Immigrants | Yemen | 0.0 /100 | #343 | Tragic $43,591 |
Demographics Similar to Swiss by Householder Income Under 25 years
In terms of householder income under 25 years, the demographic groups most similar to Swiss are Immigrants from Syria ($51,494, a difference of 0.0%), Pima ($51,503, a difference of 0.020%), Immigrants from West Indies ($51,479, a difference of 0.030%), British ($51,477, a difference of 0.030%), and Palestinian ($51,515, a difference of 0.040%).
| Demographics | Rating | Rank | Householder Income Under 25 years |
| West Indians | 18.5 /100 | #192 | Poor $51,583 |
| Immigrants | Eritrea | 18.1 /100 | #193 | Poor $51,574 |
| Guatemalans | 16.4 /100 | #194 | Poor $51,525 |
| Estonians | 16.4 /100 | #195 | Poor $51,523 |
| Palestinians | 16.1 /100 | #196 | Poor $51,515 |
| Pima | 15.7 /100 | #197 | Poor $51,503 |
| Immigrants | Syria | 15.4 /100 | #198 | Poor $51,494 |
| Swiss | 15.4 /100 | #199 | Poor $51,493 |
| Immigrants | West Indies | 14.9 /100 | #200 | Poor $51,479 |
| British | 14.9 /100 | #201 | Poor $51,477 |
| Immigrants | Guatemala | 14.0 /100 | #202 | Poor $51,447 |
| Immigrants | Cameroon | 13.6 /100 | #203 | Poor $51,433 |
| Czechs | 13.2 /100 | #204 | Poor $51,421 |
| Cape Verdeans | 12.3 /100 | #205 | Poor $51,387 |
| Immigrants | Latin America | 12.3 /100 | #206 | Poor $51,387 |