Immigrants from Sweden vs Swiss Householder Income Under 25 years
COMPARE
Immigrants from Sweden
Swiss
Householder Income Under 25 years
Householder Income Under 25 years Comparison
Immigrants from Sweden
Swiss
$53,621
HOUSEHOLDER INCOME UNDER 25 YEARS
97.1/ 100
METRIC RATING
114th/ 347
METRIC RANK
$51,493
HOUSEHOLDER INCOME UNDER 25 YEARS
15.4/ 100
METRIC RATING
199th/ 347
METRIC RANK
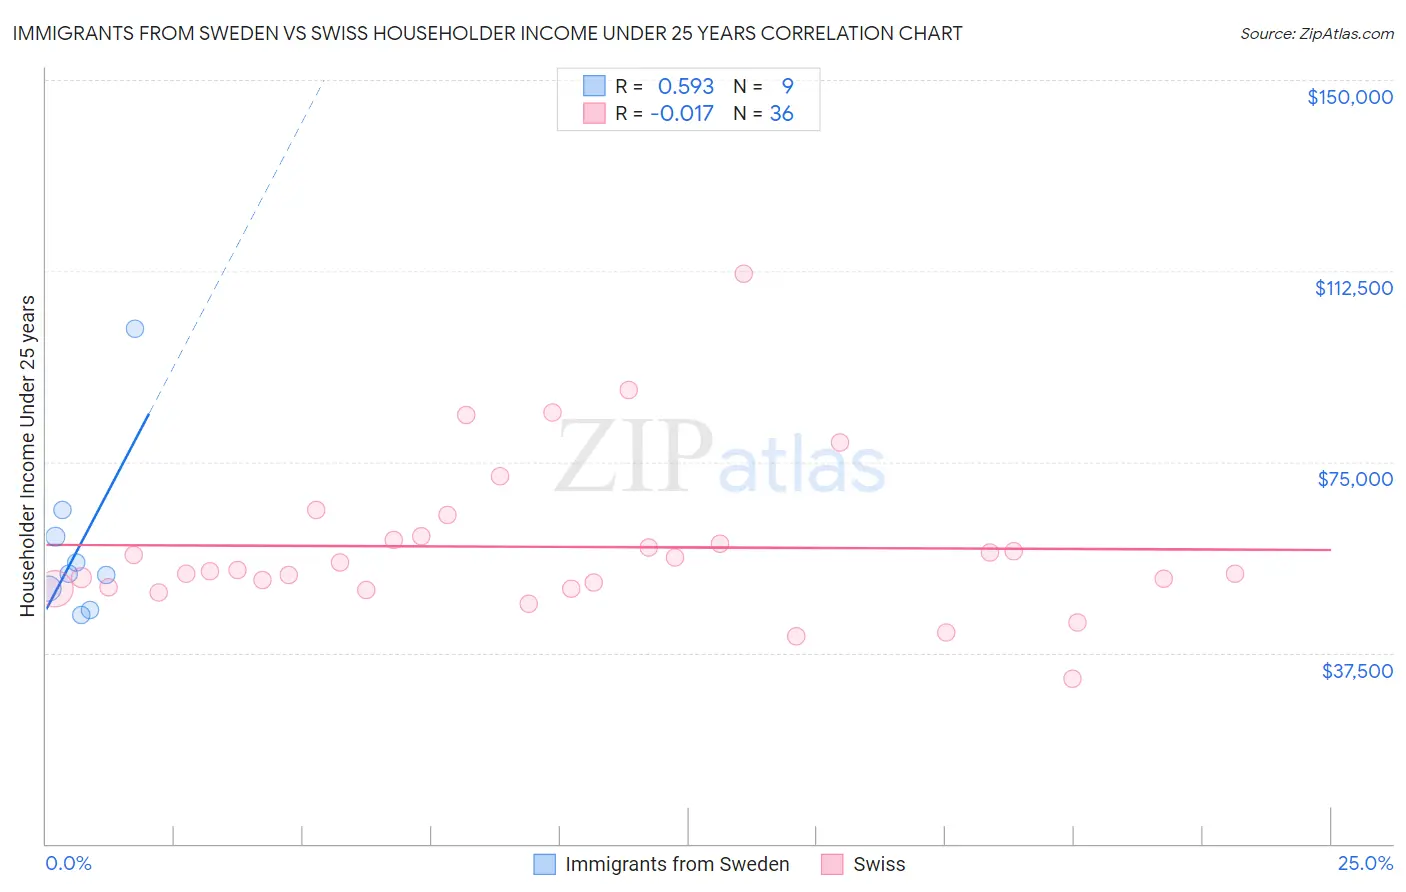
Immigrants from Sweden vs Swiss Householder Income Under 25 years Correlation Chart
The statistical analysis conducted on geographies consisting of 146,742,584 people shows a substantial positive correlation between the proportion of Immigrants from Sweden and household income with householder under the age of 25 in the United States with a correlation coefficient (R) of 0.593 and weighted average of $53,621. Similarly, the statistical analysis conducted on geographies consisting of 379,774,571 people shows no correlation between the proportion of Swiss and household income with householder under the age of 25 in the United States with a correlation coefficient (R) of -0.017 and weighted average of $51,493, a difference of 4.1%.
Householder Income Under 25 years Correlation Summary
| Measurement | Immigrants from Sweden | Swiss |
| Minimum | $44,957 | $32,411 |
| Maximum | $101,141 | $111,905 |
| Range | $56,184 | $79,494 |
| Mean | $58,786 | $58,319 |
| Median | $52,949 | $53,662 |
| Interquartile 25% (IQ1) | $48,010 | $50,296 |
| Interquartile 75% (IQ3) | $62,961 | $60,032 |
| Interquartile Range (IQR) | $14,951 | $9,736 |
| Standard Deviation (Sample) | $17,165 | $15,271 |
| Standard Deviation (Population) | $16,183 | $15,058 |
Similar Demographics by Householder Income Under 25 years
Demographics Similar to Immigrants from Sweden by Householder Income Under 25 years
In terms of householder income under 25 years, the demographic groups most similar to Immigrants from Sweden are Romanian ($53,632, a difference of 0.020%), Immigrants from Albania ($53,597, a difference of 0.040%), Immigrants from Oceania ($53,680, a difference of 0.11%), Immigrants from Spain ($53,560, a difference of 0.11%), and Lithuanian ($53,552, a difference of 0.13%).
| Demographics | Rating | Rank | Householder Income Under 25 years |
| Australians | 97.8 /100 | #107 | Exceptional $53,739 |
| Maltese | 97.8 /100 | #108 | Exceptional $53,735 |
| Immigrants | Ecuador | 97.7 /100 | #109 | Exceptional $53,722 |
| Greeks | 97.7 /100 | #110 | Exceptional $53,715 |
| Immigrants | Colombia | 97.7 /100 | #111 | Exceptional $53,714 |
| Immigrants | Oceania | 97.5 /100 | #112 | Exceptional $53,680 |
| Romanians | 97.2 /100 | #113 | Exceptional $53,632 |
| Immigrants | Sweden | 97.1 /100 | #114 | Exceptional $53,621 |
| Immigrants | Albania | 96.9 /100 | #115 | Exceptional $53,597 |
| Immigrants | Spain | 96.6 /100 | #116 | Exceptional $53,560 |
| Lithuanians | 96.6 /100 | #117 | Exceptional $53,552 |
| Immigrants | Switzerland | 96.3 /100 | #118 | Exceptional $53,528 |
| Italians | 95.4 /100 | #119 | Exceptional $53,426 |
| Guamanians/Chamorros | 95.3 /100 | #120 | Exceptional $53,423 |
| Immigrants | Canada | 95.2 /100 | #121 | Exceptional $53,411 |
Demographics Similar to Swiss by Householder Income Under 25 years
In terms of householder income under 25 years, the demographic groups most similar to Swiss are Immigrants from Syria ($51,494, a difference of 0.0%), Pima ($51,503, a difference of 0.020%), Immigrants from West Indies ($51,479, a difference of 0.030%), British ($51,477, a difference of 0.030%), and Palestinian ($51,515, a difference of 0.040%).
| Demographics | Rating | Rank | Householder Income Under 25 years |
| West Indians | 18.5 /100 | #192 | Poor $51,583 |
| Immigrants | Eritrea | 18.1 /100 | #193 | Poor $51,574 |
| Guatemalans | 16.4 /100 | #194 | Poor $51,525 |
| Estonians | 16.4 /100 | #195 | Poor $51,523 |
| Palestinians | 16.1 /100 | #196 | Poor $51,515 |
| Pima | 15.7 /100 | #197 | Poor $51,503 |
| Immigrants | Syria | 15.4 /100 | #198 | Poor $51,494 |
| Swiss | 15.4 /100 | #199 | Poor $51,493 |
| Immigrants | West Indies | 14.9 /100 | #200 | Poor $51,479 |
| British | 14.9 /100 | #201 | Poor $51,477 |
| Immigrants | Guatemala | 14.0 /100 | #202 | Poor $51,447 |
| Immigrants | Cameroon | 13.6 /100 | #203 | Poor $51,433 |
| Czechs | 13.2 /100 | #204 | Poor $51,421 |
| Cape Verdeans | 12.3 /100 | #205 | Poor $51,387 |
| Immigrants | Latin America | 12.3 /100 | #206 | Poor $51,387 |