Tohono O'odham vs Immigrants from Afghanistan Householder Income Under 25 years
COMPARE
Tohono O'odham
Immigrants from Afghanistan
Householder Income Under 25 years
Householder Income Under 25 years Comparison
Tohono O'odham
Immigrants from Afghanistan
$45,248
HOUSEHOLDER INCOME UNDER 25 YEARS
0.0/ 100
METRIC RATING
336th/ 347
METRIC RANK
$57,478
HOUSEHOLDER INCOME UNDER 25 YEARS
100.0/ 100
METRIC RATING
16th/ 347
METRIC RANK
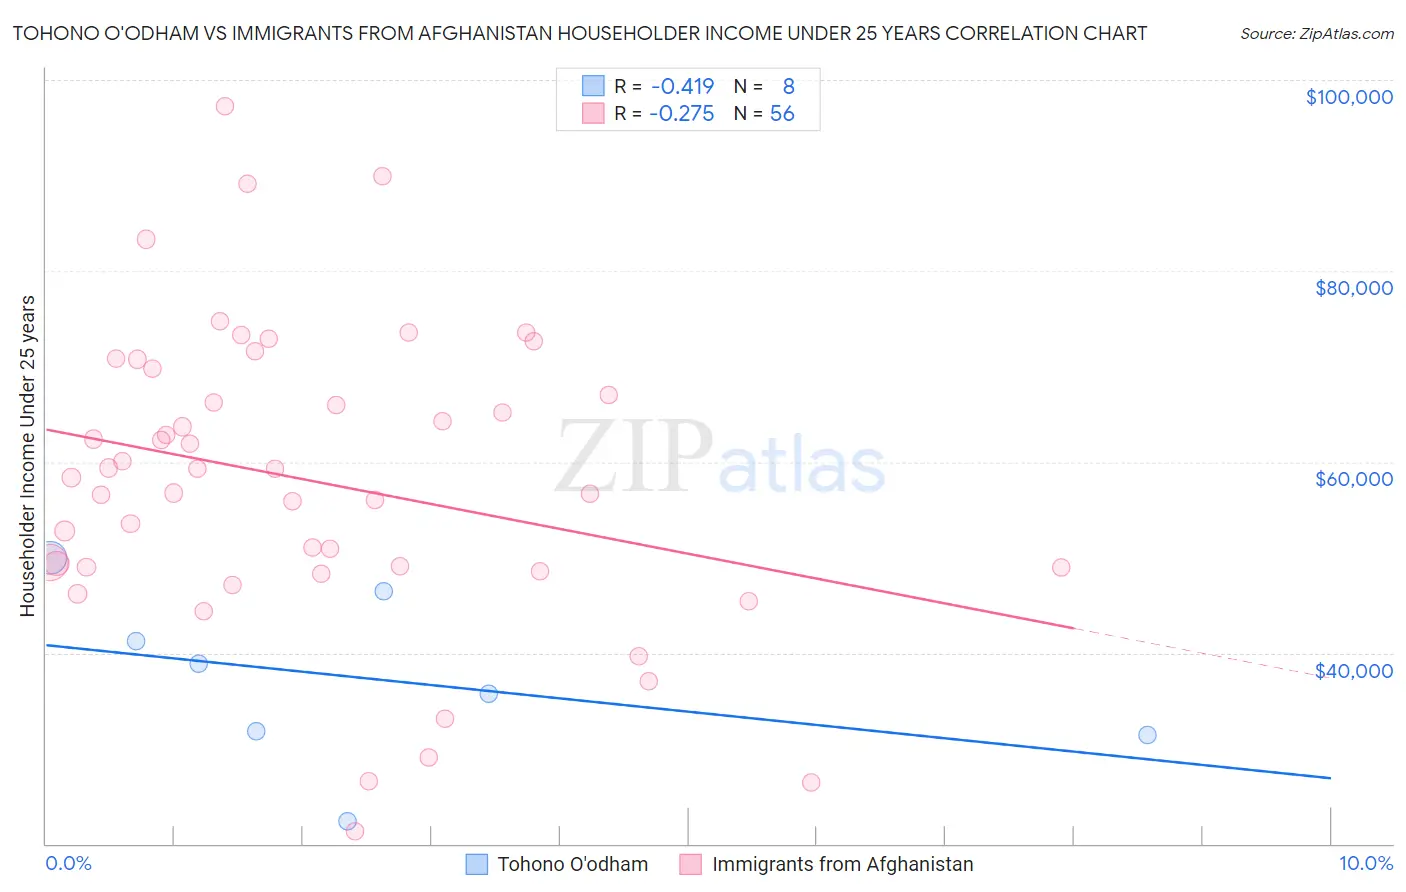
Tohono O'odham vs Immigrants from Afghanistan Householder Income Under 25 years Correlation Chart
The statistical analysis conducted on geographies consisting of 56,811,547 people shows a moderate negative correlation between the proportion of Tohono O'odham and household income with householder under the age of 25 in the United States with a correlation coefficient (R) of -0.419 and weighted average of $45,248. Similarly, the statistical analysis conducted on geographies consisting of 135,231,575 people shows a weak negative correlation between the proportion of Immigrants from Afghanistan and household income with householder under the age of 25 in the United States with a correlation coefficient (R) of -0.275 and weighted average of $57,478, a difference of 27.0%.
Householder Income Under 25 years Correlation Summary
| Measurement | Tohono O'odham | Immigrants from Afghanistan |
| Minimum | $22,412 | $21,359 |
| Maximum | $49,920 | $97,219 |
| Range | $27,507 | $75,860 |
| Mean | $37,222 | $58,040 |
| Median | $37,258 | $58,817 |
| Interquartile 25% (IQ1) | $31,632 | $48,980 |
| Interquartile 75% (IQ3) | $43,831 | $68,376 |
| Interquartile Range (IQR) | $12,199 | $19,397 |
| Standard Deviation (Sample) | $8,859 | $15,706 |
| Standard Deviation (Population) | $8,287 | $15,565 |
Similar Demographics by Householder Income Under 25 years
Demographics Similar to Tohono O'odham by Householder Income Under 25 years
In terms of householder income under 25 years, the demographic groups most similar to Tohono O'odham are Cheyenne ($45,275, a difference of 0.060%), Cajun ($45,338, a difference of 0.20%), Creek ($45,371, a difference of 0.27%), Choctaw ($45,450, a difference of 0.45%), and Pueblo ($45,018, a difference of 0.51%).
| Demographics | Rating | Rank | Householder Income Under 25 years |
| Seminole | 0.0 /100 | #329 | Tragic $45,649 |
| Indonesians | 0.0 /100 | #330 | Tragic $45,566 |
| Immigrants | Zaire | 0.0 /100 | #331 | Tragic $45,529 |
| Choctaw | 0.0 /100 | #332 | Tragic $45,450 |
| Creek | 0.0 /100 | #333 | Tragic $45,371 |
| Cajuns | 0.0 /100 | #334 | Tragic $45,338 |
| Cheyenne | 0.0 /100 | #335 | Tragic $45,275 |
| Tohono O'odham | 0.0 /100 | #336 | Tragic $45,248 |
| Pueblo | 0.0 /100 | #337 | Tragic $45,018 |
| Chickasaw | 0.0 /100 | #338 | Tragic $44,763 |
| Kiowa | 0.0 /100 | #339 | Tragic $44,733 |
| Blacks/African Americans | 0.0 /100 | #340 | Tragic $44,381 |
| Houma | 0.0 /100 | #341 | Tragic $44,356 |
| Arapaho | 0.0 /100 | #342 | Tragic $44,003 |
| Immigrants | Yemen | 0.0 /100 | #343 | Tragic $43,591 |
Demographics Similar to Immigrants from Afghanistan by Householder Income Under 25 years
In terms of householder income under 25 years, the demographic groups most similar to Immigrants from Afghanistan are Sierra Leonean ($57,272, a difference of 0.36%), Korean ($57,730, a difference of 0.44%), Filipino ($57,740, a difference of 0.46%), Immigrants from South Central Asia ($57,818, a difference of 0.59%), and Immigrants from Eastern Asia ($57,123, a difference of 0.62%).
| Demographics | Rating | Rank | Householder Income Under 25 years |
| Chinese | 100.0 /100 | #9 | Exceptional $58,162 |
| Afghans | 100.0 /100 | #10 | Exceptional $58,019 |
| Immigrants | China | 100.0 /100 | #11 | Exceptional $57,931 |
| Immigrants | Philippines | 100.0 /100 | #12 | Exceptional $57,930 |
| Immigrants | South Central Asia | 100.0 /100 | #13 | Exceptional $57,818 |
| Filipinos | 100.0 /100 | #14 | Exceptional $57,740 |
| Koreans | 100.0 /100 | #15 | Exceptional $57,730 |
| Immigrants | Afghanistan | 100.0 /100 | #16 | Exceptional $57,478 |
| Sierra Leoneans | 100.0 /100 | #17 | Exceptional $57,272 |
| Immigrants | Eastern Asia | 100.0 /100 | #18 | Exceptional $57,123 |
| Bhutanese | 100.0 /100 | #19 | Exceptional $57,078 |
| Immigrants | Ireland | 100.0 /100 | #20 | Exceptional $57,075 |
| Immigrants | Fiji | 100.0 /100 | #21 | Exceptional $57,074 |
| Asians | 100.0 /100 | #22 | Exceptional $57,003 |
| Tongans | 100.0 /100 | #23 | Exceptional $56,972 |