Tohono O'odham vs Immigrants from Bolivia Householder Income Under 25 years
COMPARE
Tohono O'odham
Immigrants from Bolivia
Householder Income Under 25 years
Householder Income Under 25 years Comparison
Tohono O'odham
Immigrants from Bolivia
$45,248
HOUSEHOLDER INCOME UNDER 25 YEARS
0.0/ 100
METRIC RATING
336th/ 347
METRIC RANK
$59,389
HOUSEHOLDER INCOME UNDER 25 YEARS
100.0/ 100
METRIC RATING
5th/ 347
METRIC RANK
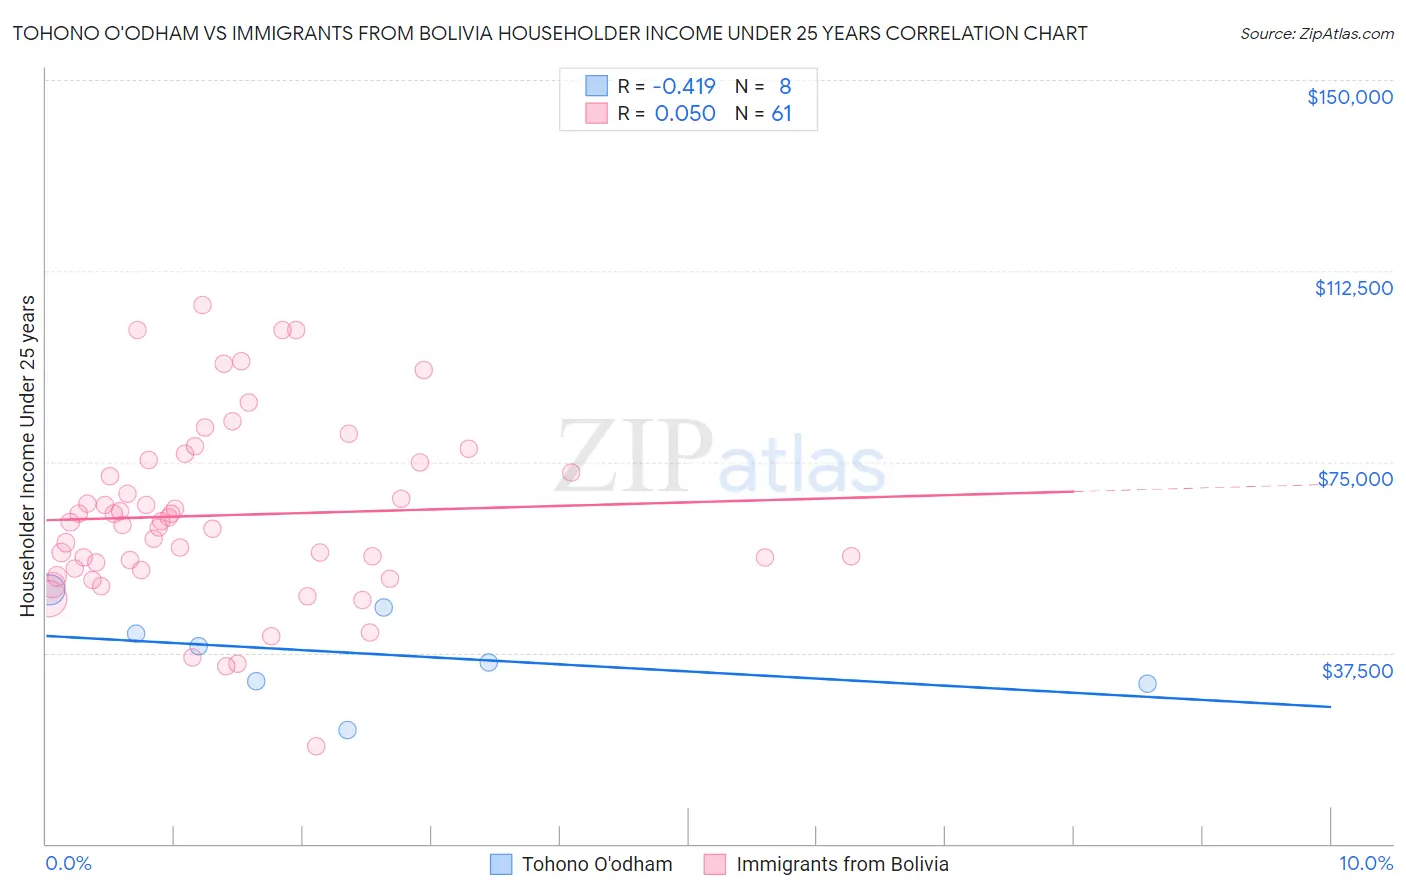
Tohono O'odham vs Immigrants from Bolivia Householder Income Under 25 years Correlation Chart
The statistical analysis conducted on geographies consisting of 56,811,547 people shows a moderate negative correlation between the proportion of Tohono O'odham and household income with householder under the age of 25 in the United States with a correlation coefficient (R) of -0.419 and weighted average of $45,248. Similarly, the statistical analysis conducted on geographies consisting of 144,172,056 people shows no correlation between the proportion of Immigrants from Bolivia and household income with householder under the age of 25 in the United States with a correlation coefficient (R) of 0.050 and weighted average of $59,389, a difference of 31.2%.
Householder Income Under 25 years Correlation Summary
| Measurement | Tohono O'odham | Immigrants from Bolivia |
| Minimum | $22,412 | $19,038 |
| Maximum | $49,920 | $105,833 |
| Range | $27,507 | $86,795 |
| Mean | $37,222 | $64,519 |
| Median | $37,258 | $63,188 |
| Interquartile 25% (IQ1) | $31,632 | $53,841 |
| Interquartile 75% (IQ3) | $43,831 | $75,085 |
| Interquartile Range (IQR) | $12,199 | $21,244 |
| Standard Deviation (Sample) | $8,859 | $17,670 |
| Standard Deviation (Population) | $8,287 | $17,525 |
Similar Demographics by Householder Income Under 25 years
Demographics Similar to Tohono O'odham by Householder Income Under 25 years
In terms of householder income under 25 years, the demographic groups most similar to Tohono O'odham are Cheyenne ($45,275, a difference of 0.060%), Cajun ($45,338, a difference of 0.20%), Creek ($45,371, a difference of 0.27%), Choctaw ($45,450, a difference of 0.45%), and Pueblo ($45,018, a difference of 0.51%).
| Demographics | Rating | Rank | Householder Income Under 25 years |
| Seminole | 0.0 /100 | #329 | Tragic $45,649 |
| Indonesians | 0.0 /100 | #330 | Tragic $45,566 |
| Immigrants | Zaire | 0.0 /100 | #331 | Tragic $45,529 |
| Choctaw | 0.0 /100 | #332 | Tragic $45,450 |
| Creek | 0.0 /100 | #333 | Tragic $45,371 |
| Cajuns | 0.0 /100 | #334 | Tragic $45,338 |
| Cheyenne | 0.0 /100 | #335 | Tragic $45,275 |
| Tohono O'odham | 0.0 /100 | #336 | Tragic $45,248 |
| Pueblo | 0.0 /100 | #337 | Tragic $45,018 |
| Chickasaw | 0.0 /100 | #338 | Tragic $44,763 |
| Kiowa | 0.0 /100 | #339 | Tragic $44,733 |
| Blacks/African Americans | 0.0 /100 | #340 | Tragic $44,381 |
| Houma | 0.0 /100 | #341 | Tragic $44,356 |
| Arapaho | 0.0 /100 | #342 | Tragic $44,003 |
| Immigrants | Yemen | 0.0 /100 | #343 | Tragic $43,591 |
Demographics Similar to Immigrants from Bolivia by Householder Income Under 25 years
In terms of householder income under 25 years, the demographic groups most similar to Immigrants from Bolivia are Immigrants from Taiwan ($59,424, a difference of 0.060%), Thai ($59,187, a difference of 0.34%), Immigrants from India ($59,914, a difference of 0.88%), Bolivian ($58,506, a difference of 1.5%), and Indian (Asian) ($58,239, a difference of 2.0%).
| Demographics | Rating | Rank | Householder Income Under 25 years |
| Assyrians/Chaldeans/Syriacs | 100.0 /100 | #1 | Exceptional $65,329 |
| Immigrants | Hong Kong | 100.0 /100 | #2 | Exceptional $62,083 |
| Immigrants | India | 100.0 /100 | #3 | Exceptional $59,914 |
| Immigrants | Taiwan | 100.0 /100 | #4 | Exceptional $59,424 |
| Immigrants | Bolivia | 100.0 /100 | #5 | Exceptional $59,389 |
| Thais | 100.0 /100 | #6 | Exceptional $59,187 |
| Bolivians | 100.0 /100 | #7 | Exceptional $58,506 |
| Indians (Asian) | 100.0 /100 | #8 | Exceptional $58,239 |
| Chinese | 100.0 /100 | #9 | Exceptional $58,162 |
| Afghans | 100.0 /100 | #10 | Exceptional $58,019 |
| Immigrants | China | 100.0 /100 | #11 | Exceptional $57,931 |
| Immigrants | Philippines | 100.0 /100 | #12 | Exceptional $57,930 |
| Immigrants | South Central Asia | 100.0 /100 | #13 | Exceptional $57,818 |
| Filipinos | 100.0 /100 | #14 | Exceptional $57,740 |
| Koreans | 100.0 /100 | #15 | Exceptional $57,730 |