Tohono O'odham vs Welsh Householder Income Under 25 years
COMPARE
Tohono O'odham
Welsh
Householder Income Under 25 years
Householder Income Under 25 years Comparison
Tohono O'odham
Welsh
$45,248
HOUSEHOLDER INCOME UNDER 25 YEARS
0.0/ 100
METRIC RATING
336th/ 347
METRIC RANK
$50,597
HOUSEHOLDER INCOME UNDER 25 YEARS
2.0/ 100
METRIC RATING
246th/ 347
METRIC RANK
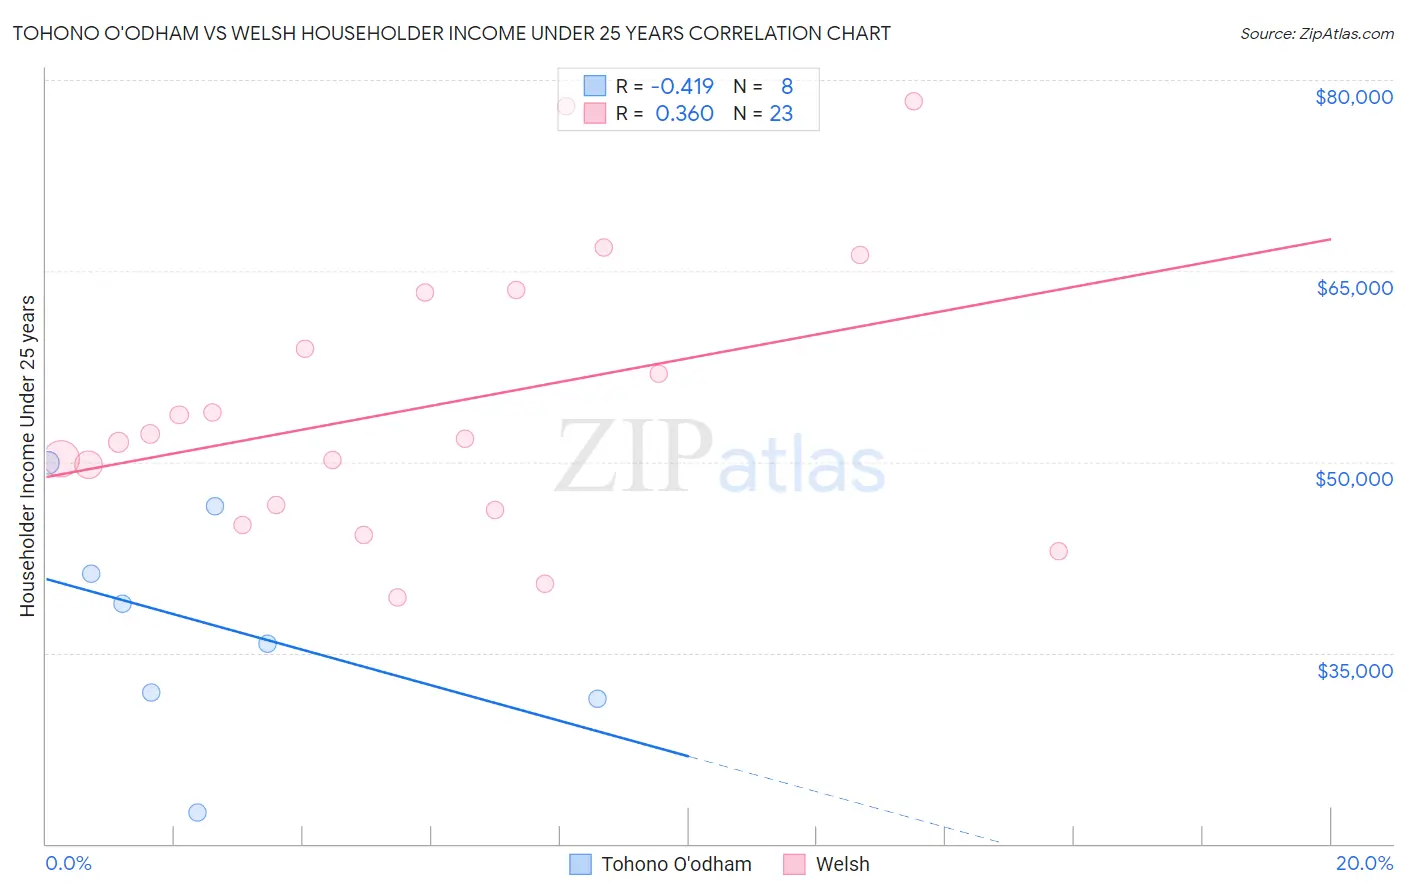
Tohono O'odham vs Welsh Householder Income Under 25 years Correlation Chart
The statistical analysis conducted on geographies consisting of 56,811,547 people shows a moderate negative correlation between the proportion of Tohono O'odham and household income with householder under the age of 25 in the United States with a correlation coefficient (R) of -0.419 and weighted average of $45,248. Similarly, the statistical analysis conducted on geographies consisting of 418,128,856 people shows a mild positive correlation between the proportion of Welsh and household income with householder under the age of 25 in the United States with a correlation coefficient (R) of 0.360 and weighted average of $50,597, a difference of 11.8%.
Householder Income Under 25 years Correlation Summary
| Measurement | Tohono O'odham | Welsh |
| Minimum | $22,412 | $39,341 |
| Maximum | $49,920 | $78,342 |
| Range | $27,507 | $39,001 |
| Mean | $37,222 | $54,354 |
| Median | $37,258 | $51,818 |
| Interquartile 25% (IQ1) | $31,632 | $46,242 |
| Interquartile 75% (IQ3) | $43,831 | $63,259 |
| Interquartile Range (IQR) | $12,199 | $17,017 |
| Standard Deviation (Sample) | $8,859 | $10,784 |
| Standard Deviation (Population) | $8,287 | $10,547 |
Similar Demographics by Householder Income Under 25 years
Demographics Similar to Tohono O'odham by Householder Income Under 25 years
In terms of householder income under 25 years, the demographic groups most similar to Tohono O'odham are Cheyenne ($45,275, a difference of 0.060%), Cajun ($45,338, a difference of 0.20%), Creek ($45,371, a difference of 0.27%), Choctaw ($45,450, a difference of 0.45%), and Pueblo ($45,018, a difference of 0.51%).
| Demographics | Rating | Rank | Householder Income Under 25 years |
| Seminole | 0.0 /100 | #329 | Tragic $45,649 |
| Indonesians | 0.0 /100 | #330 | Tragic $45,566 |
| Immigrants | Zaire | 0.0 /100 | #331 | Tragic $45,529 |
| Choctaw | 0.0 /100 | #332 | Tragic $45,450 |
| Creek | 0.0 /100 | #333 | Tragic $45,371 |
| Cajuns | 0.0 /100 | #334 | Tragic $45,338 |
| Cheyenne | 0.0 /100 | #335 | Tragic $45,275 |
| Tohono O'odham | 0.0 /100 | #336 | Tragic $45,248 |
| Pueblo | 0.0 /100 | #337 | Tragic $45,018 |
| Chickasaw | 0.0 /100 | #338 | Tragic $44,763 |
| Kiowa | 0.0 /100 | #339 | Tragic $44,733 |
| Blacks/African Americans | 0.0 /100 | #340 | Tragic $44,381 |
| Houma | 0.0 /100 | #341 | Tragic $44,356 |
| Arapaho | 0.0 /100 | #342 | Tragic $44,003 |
| Immigrants | Yemen | 0.0 /100 | #343 | Tragic $43,591 |
Demographics Similar to Welsh by Householder Income Under 25 years
In terms of householder income under 25 years, the demographic groups most similar to Welsh are Immigrants from Africa ($50,609, a difference of 0.020%), Marshallese ($50,627, a difference of 0.060%), Immigrants from Bosnia and Herzegovina ($50,565, a difference of 0.060%), Slavic ($50,563, a difference of 0.070%), and Scottish ($50,554, a difference of 0.090%).
| Demographics | Rating | Rank | Householder Income Under 25 years |
| Immigrants | Caribbean | 2.9 /100 | #239 | Tragic $50,757 |
| Immigrants | Lebanon | 2.7 /100 | #240 | Tragic $50,729 |
| Immigrants | Micronesia | 2.5 /100 | #241 | Tragic $50,691 |
| Cubans | 2.3 /100 | #242 | Tragic $50,655 |
| Immigrants | Thailand | 2.2 /100 | #243 | Tragic $50,645 |
| Marshallese | 2.1 /100 | #244 | Tragic $50,627 |
| Immigrants | Africa | 2.0 /100 | #245 | Tragic $50,609 |
| Welsh | 2.0 /100 | #246 | Tragic $50,597 |
| Immigrants | Bosnia and Herzegovina | 1.8 /100 | #247 | Tragic $50,565 |
| Slavs | 1.8 /100 | #248 | Tragic $50,563 |
| Scottish | 1.8 /100 | #249 | Tragic $50,554 |
| Immigrants | Cabo Verde | 1.7 /100 | #250 | Tragic $50,520 |
| Celtics | 1.4 /100 | #251 | Tragic $50,447 |
| Immigrants | Mexico | 1.3 /100 | #252 | Tragic $50,422 |
| Immigrants | Haiti | 1.2 /100 | #253 | Tragic $50,398 |