Immigrants from England vs Swiss Householder Income Under 25 years
COMPARE
Immigrants from England
Swiss
Householder Income Under 25 years
Householder Income Under 25 years Comparison
Immigrants from England
Swiss
$51,817
HOUSEHOLDER INCOME UNDER 25 YEARS
28.7/ 100
METRIC RATING
180th/ 347
METRIC RANK
$51,493
HOUSEHOLDER INCOME UNDER 25 YEARS
15.4/ 100
METRIC RATING
199th/ 347
METRIC RANK
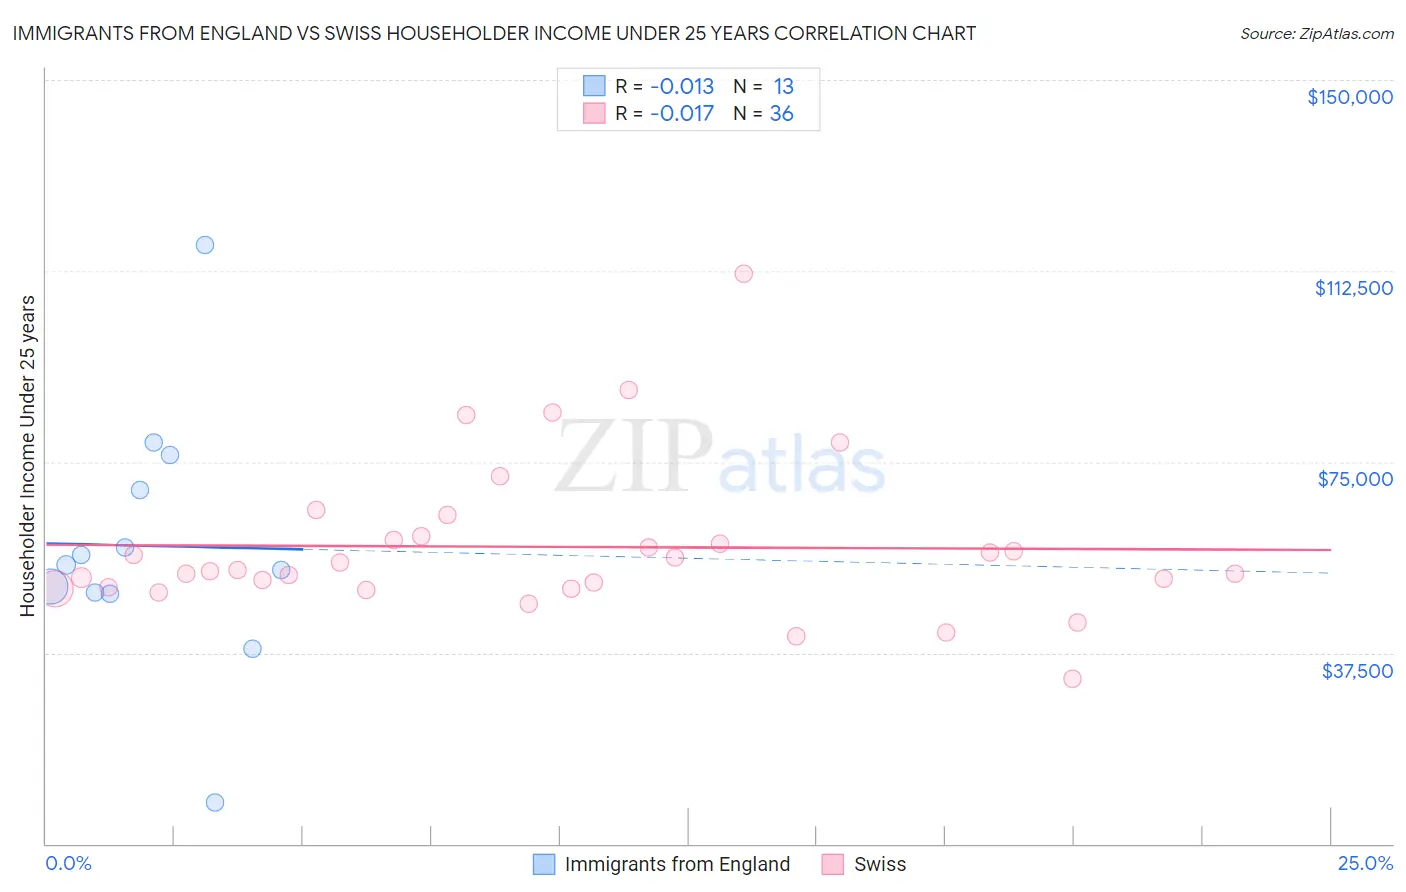
Immigrants from England vs Swiss Householder Income Under 25 years Correlation Chart
The statistical analysis conducted on geographies consisting of 326,167,300 people shows no correlation between the proportion of Immigrants from England and household income with householder under the age of 25 in the United States with a correlation coefficient (R) of -0.013 and weighted average of $51,817. Similarly, the statistical analysis conducted on geographies consisting of 379,774,571 people shows no correlation between the proportion of Swiss and household income with householder under the age of 25 in the United States with a correlation coefficient (R) of -0.017 and weighted average of $51,493, a difference of 0.63%.
Householder Income Under 25 years Correlation Summary
| Measurement | Immigrants from England | Swiss |
| Minimum | $8,124 | $32,411 |
| Maximum | $117,638 | $111,905 |
| Range | $109,515 | $79,494 |
| Mean | $58,520 | $58,319 |
| Median | $54,780 | $53,662 |
| Interquartile 25% (IQ1) | $49,205 | $50,296 |
| Interquartile 75% (IQ3) | $72,891 | $60,032 |
| Interquartile Range (IQR) | $23,686 | $9,736 |
| Standard Deviation (Sample) | $25,115 | $15,271 |
| Standard Deviation (Population) | $24,130 | $15,058 |
Demographics Similar to Immigrants from England and Swiss by Householder Income Under 25 years
In terms of householder income under 25 years, the demographic groups most similar to Immigrants from England are Basque ($51,818, a difference of 0.0%), European ($51,796, a difference of 0.040%), Jordanian ($51,796, a difference of 0.040%), Mexican American Indian ($51,783, a difference of 0.070%), and Paiute ($51,743, a difference of 0.14%). Similarly, the demographic groups most similar to Swiss are Immigrants from Syria ($51,494, a difference of 0.0%), Pima ($51,503, a difference of 0.020%), Palestinian ($51,515, a difference of 0.040%), Guatemalan ($51,525, a difference of 0.060%), and Estonian ($51,523, a difference of 0.060%).
| Demographics | Rating | Rank | Householder Income Under 25 years |
| Basques | 28.7 /100 | #179 | Fair $51,818 |
| Immigrants | England | 28.7 /100 | #180 | Fair $51,817 |
| Europeans | 27.6 /100 | #181 | Fair $51,796 |
| Jordanians | 27.6 /100 | #182 | Fair $51,796 |
| Mexican American Indians | 27.0 /100 | #183 | Fair $51,783 |
| Paiute | 25.1 /100 | #184 | Fair $51,743 |
| Immigrants | Latvia | 24.8 /100 | #185 | Fair $51,737 |
| Alaskan Athabascans | 23.8 /100 | #186 | Fair $51,713 |
| Immigrants | South Africa | 23.4 /100 | #187 | Fair $51,705 |
| Northern Europeans | 22.2 /100 | #188 | Fair $51,678 |
| Croatians | 21.6 /100 | #189 | Fair $51,662 |
| Malaysians | 19.7 /100 | #190 | Poor $51,615 |
| Panamanians | 19.5 /100 | #191 | Poor $51,611 |
| West Indians | 18.5 /100 | #192 | Poor $51,583 |
| Immigrants | Eritrea | 18.1 /100 | #193 | Poor $51,574 |
| Guatemalans | 16.4 /100 | #194 | Poor $51,525 |
| Estonians | 16.4 /100 | #195 | Poor $51,523 |
| Palestinians | 16.1 /100 | #196 | Poor $51,515 |
| Pima | 15.7 /100 | #197 | Poor $51,503 |
| Immigrants | Syria | 15.4 /100 | #198 | Poor $51,494 |
| Swiss | 15.4 /100 | #199 | Poor $51,493 |