Tohono O'odham vs Kiowa Householder Income Under 25 years
COMPARE
Tohono O'odham
Kiowa
Householder Income Under 25 years
Householder Income Under 25 years Comparison
Tohono O'odham
Kiowa
$45,248
HOUSEHOLDER INCOME UNDER 25 YEARS
0.0/ 100
METRIC RATING
336th/ 347
METRIC RANK
$44,733
HOUSEHOLDER INCOME UNDER 25 YEARS
0.0/ 100
METRIC RATING
339th/ 347
METRIC RANK
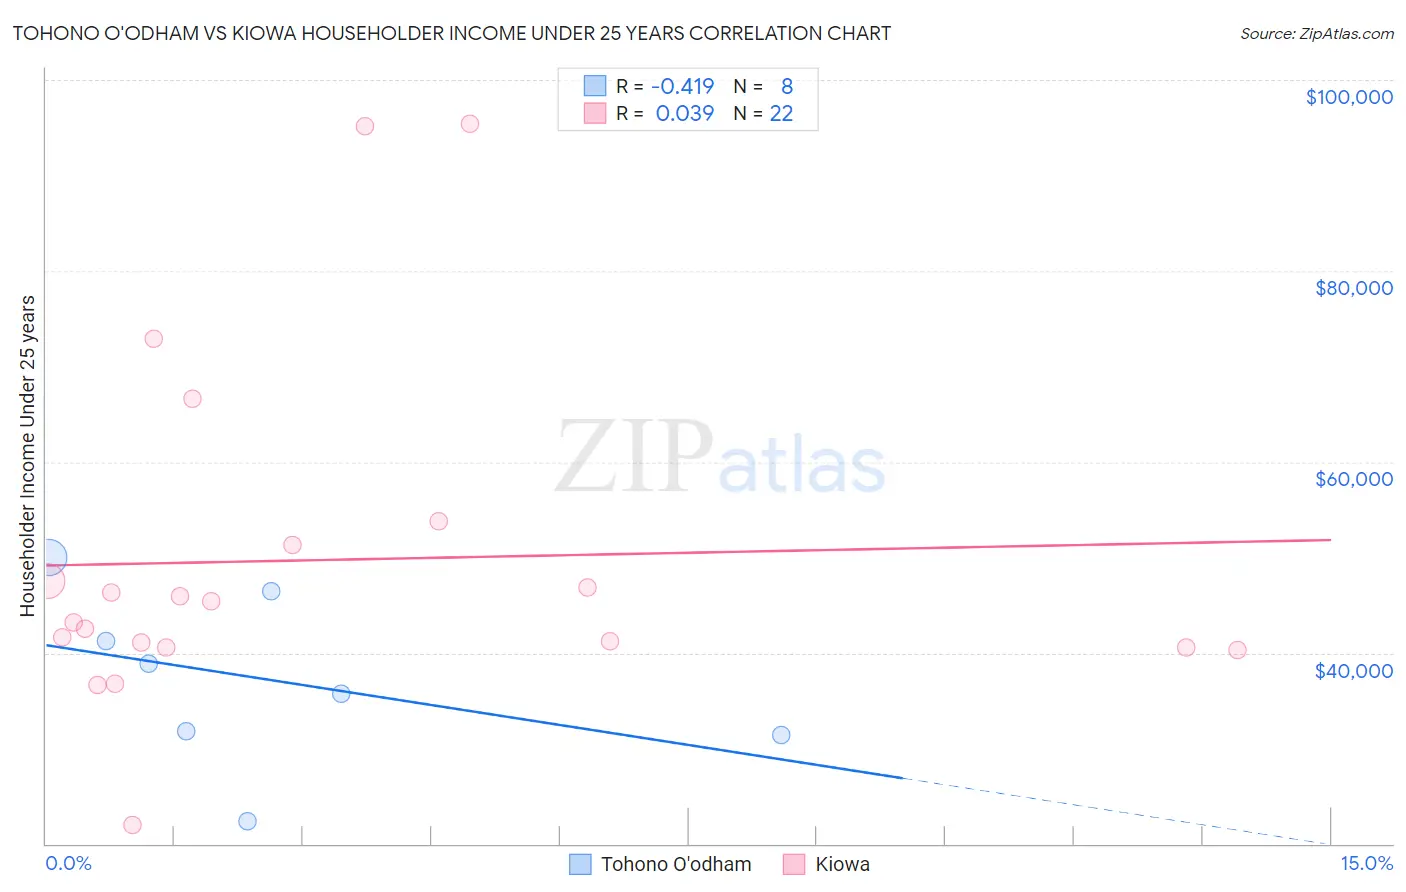
Tohono O'odham vs Kiowa Householder Income Under 25 years Correlation Chart
The statistical analysis conducted on geographies consisting of 56,811,547 people shows a moderate negative correlation between the proportion of Tohono O'odham and household income with householder under the age of 25 in the United States with a correlation coefficient (R) of -0.419 and weighted average of $45,248. Similarly, the statistical analysis conducted on geographies consisting of 54,795,251 people shows no correlation between the proportion of Kiowa and household income with householder under the age of 25 in the United States with a correlation coefficient (R) of 0.039 and weighted average of $44,733, a difference of 1.1%.
Householder Income Under 25 years Correlation Summary
| Measurement | Tohono O'odham | Kiowa |
| Minimum | $22,412 | $21,932 |
| Maximum | $49,920 | $95,455 |
| Range | $27,507 | $73,523 |
| Mean | $37,222 | $49,706 |
| Median | $37,258 | $44,320 |
| Interquartile 25% (IQ1) | $31,632 | $40,500 |
| Interquartile 75% (IQ3) | $43,831 | $51,250 |
| Interquartile Range (IQR) | $12,199 | $10,750 |
| Standard Deviation (Sample) | $8,859 | $17,903 |
| Standard Deviation (Population) | $8,287 | $17,492 |
Demographics Similar to Tohono O'odham and Kiowa by Householder Income Under 25 years
In terms of householder income under 25 years, the demographic groups most similar to Tohono O'odham are Cheyenne ($45,275, a difference of 0.060%), Cajun ($45,338, a difference of 0.20%), Creek ($45,371, a difference of 0.27%), Choctaw ($45,450, a difference of 0.45%), and Pueblo ($45,018, a difference of 0.51%). Similarly, the demographic groups most similar to Kiowa are Chickasaw ($44,763, a difference of 0.070%), Pueblo ($45,018, a difference of 0.64%), Black/African American ($44,381, a difference of 0.79%), Houma ($44,356, a difference of 0.85%), and Cheyenne ($45,275, a difference of 1.2%).
| Demographics | Rating | Rank | Householder Income Under 25 years |
| Bahamians | 0.0 /100 | #327 | Tragic $45,743 |
| German Russians | 0.0 /100 | #328 | Tragic $45,673 |
| Seminole | 0.0 /100 | #329 | Tragic $45,649 |
| Indonesians | 0.0 /100 | #330 | Tragic $45,566 |
| Immigrants | Zaire | 0.0 /100 | #331 | Tragic $45,529 |
| Choctaw | 0.0 /100 | #332 | Tragic $45,450 |
| Creek | 0.0 /100 | #333 | Tragic $45,371 |
| Cajuns | 0.0 /100 | #334 | Tragic $45,338 |
| Cheyenne | 0.0 /100 | #335 | Tragic $45,275 |
| Tohono O'odham | 0.0 /100 | #336 | Tragic $45,248 |
| Pueblo | 0.0 /100 | #337 | Tragic $45,018 |
| Chickasaw | 0.0 /100 | #338 | Tragic $44,763 |
| Kiowa | 0.0 /100 | #339 | Tragic $44,733 |
| Blacks/African Americans | 0.0 /100 | #340 | Tragic $44,381 |
| Houma | 0.0 /100 | #341 | Tragic $44,356 |
| Arapaho | 0.0 /100 | #342 | Tragic $44,003 |
| Immigrants | Yemen | 0.0 /100 | #343 | Tragic $43,591 |
| Immigrants | Congo | 0.0 /100 | #344 | Tragic $43,266 |
| Navajo | 0.0 /100 | #345 | Tragic $42,380 |
| Puerto Ricans | 0.0 /100 | #346 | Tragic $39,726 |
| Lumbee | 0.0 /100 | #347 | Tragic $34,584 |