Tohono O'odham vs Hopi Householder Income Under 25 years
COMPARE
Tohono O'odham
Hopi
Householder Income Under 25 years
Householder Income Under 25 years Comparison
Tohono O'odham
Hopi
$45,248
HOUSEHOLDER INCOME UNDER 25 YEARS
0.0/ 100
METRIC RATING
336th/ 347
METRIC RANK
$46,978
HOUSEHOLDER INCOME UNDER 25 YEARS
0.0/ 100
METRIC RATING
317th/ 347
METRIC RANK
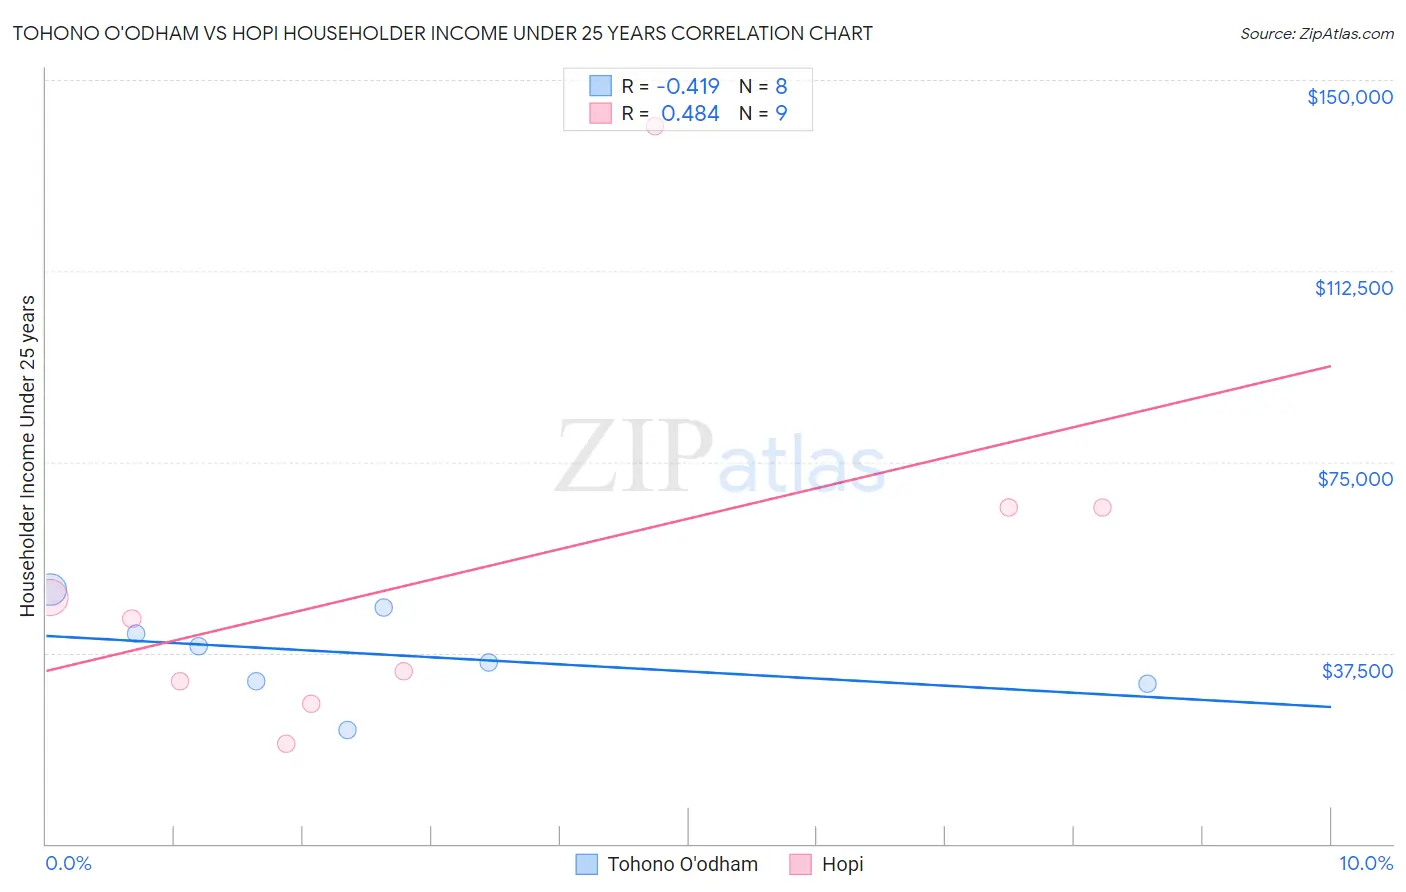
Tohono O'odham vs Hopi Householder Income Under 25 years Correlation Chart
The statistical analysis conducted on geographies consisting of 56,811,547 people shows a moderate negative correlation between the proportion of Tohono O'odham and household income with householder under the age of 25 in the United States with a correlation coefficient (R) of -0.419 and weighted average of $45,248. Similarly, the statistical analysis conducted on geographies consisting of 71,204,870 people shows a moderate positive correlation between the proportion of Hopi and household income with householder under the age of 25 in the United States with a correlation coefficient (R) of 0.484 and weighted average of $46,978, a difference of 3.8%.
Householder Income Under 25 years Correlation Summary
| Measurement | Tohono O'odham | Hopi |
| Minimum | $22,412 | $19,702 |
| Maximum | $49,920 | $140,893 |
| Range | $27,507 | $121,191 |
| Mean | $37,222 | $53,152 |
| Median | $37,258 | $44,111 |
| Interquartile 25% (IQ1) | $31,632 | $29,638 |
| Interquartile 75% (IQ3) | $43,831 | $66,100 |
| Interquartile Range (IQR) | $12,199 | $36,462 |
| Standard Deviation (Sample) | $8,859 | $36,652 |
| Standard Deviation (Population) | $8,287 | $34,555 |
Demographics Similar to Tohono O'odham and Hopi by Householder Income Under 25 years
In terms of householder income under 25 years, the demographic groups most similar to Tohono O'odham are Cheyenne ($45,275, a difference of 0.060%), Cajun ($45,338, a difference of 0.20%), Creek ($45,371, a difference of 0.27%), Choctaw ($45,450, a difference of 0.45%), and Immigrants from Zaire ($45,529, a difference of 0.62%). Similarly, the demographic groups most similar to Hopi are Sudanese ($46,982, a difference of 0.010%), Spanish American ($46,913, a difference of 0.14%), African ($46,838, a difference of 0.30%), Immigrants from Sudan ($46,791, a difference of 0.40%), and Potawatomi ($46,462, a difference of 1.1%).
| Demographics | Rating | Rank | Householder Income Under 25 years |
| Sudanese | 0.0 /100 | #316 | Tragic $46,982 |
| Hopi | 0.0 /100 | #317 | Tragic $46,978 |
| Spanish Americans | 0.0 /100 | #318 | Tragic $46,913 |
| Africans | 0.0 /100 | #319 | Tragic $46,838 |
| Immigrants | Sudan | 0.0 /100 | #320 | Tragic $46,791 |
| Potawatomi | 0.0 /100 | #321 | Tragic $46,462 |
| Sioux | 0.0 /100 | #322 | Tragic $46,417 |
| Immigrants | Saudi Arabia | 0.0 /100 | #323 | Tragic $46,187 |
| Dutch West Indians | 0.0 /100 | #324 | Tragic $45,816 |
| Immigrants | Bahamas | 0.0 /100 | #325 | Tragic $45,793 |
| Osage | 0.0 /100 | #326 | Tragic $45,764 |
| Bahamians | 0.0 /100 | #327 | Tragic $45,743 |
| German Russians | 0.0 /100 | #328 | Tragic $45,673 |
| Seminole | 0.0 /100 | #329 | Tragic $45,649 |
| Indonesians | 0.0 /100 | #330 | Tragic $45,566 |
| Immigrants | Zaire | 0.0 /100 | #331 | Tragic $45,529 |
| Choctaw | 0.0 /100 | #332 | Tragic $45,450 |
| Creek | 0.0 /100 | #333 | Tragic $45,371 |
| Cajuns | 0.0 /100 | #334 | Tragic $45,338 |
| Cheyenne | 0.0 /100 | #335 | Tragic $45,275 |
| Tohono O'odham | 0.0 /100 | #336 | Tragic $45,248 |