Immigrants from Guyana vs Swiss Householder Income Under 25 years
COMPARE
Immigrants from Guyana
Swiss
Householder Income Under 25 years
Householder Income Under 25 years Comparison
Immigrants from Guyana
Swiss
$55,726
HOUSEHOLDER INCOME UNDER 25 YEARS
100.0/ 100
METRIC RATING
41st/ 347
METRIC RANK
$51,493
HOUSEHOLDER INCOME UNDER 25 YEARS
15.4/ 100
METRIC RATING
199th/ 347
METRIC RANK
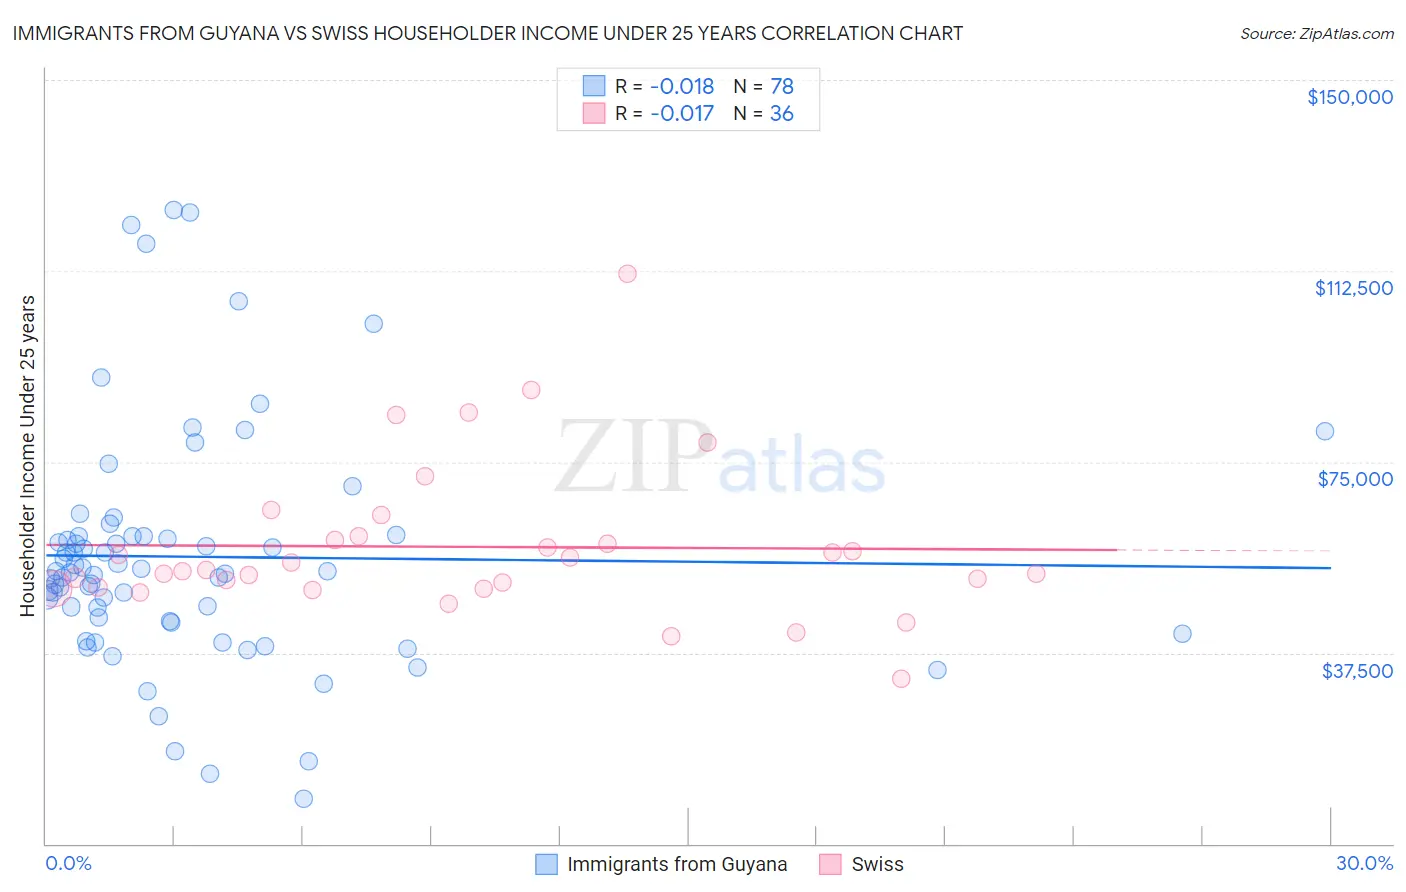
Immigrants from Guyana vs Swiss Householder Income Under 25 years Correlation Chart
The statistical analysis conducted on geographies consisting of 159,030,692 people shows no correlation between the proportion of Immigrants from Guyana and household income with householder under the age of 25 in the United States with a correlation coefficient (R) of -0.018 and weighted average of $55,726. Similarly, the statistical analysis conducted on geographies consisting of 379,774,571 people shows no correlation between the proportion of Swiss and household income with householder under the age of 25 in the United States with a correlation coefficient (R) of -0.017 and weighted average of $51,493, a difference of 8.2%.
Householder Income Under 25 years Correlation Summary
| Measurement | Immigrants from Guyana | Swiss |
| Minimum | $8,838 | $32,411 |
| Maximum | $124,392 | $111,905 |
| Range | $115,554 | $79,494 |
| Mean | $56,359 | $58,319 |
| Median | $53,366 | $53,662 |
| Interquartile 25% (IQ1) | $43,724 | $50,296 |
| Interquartile 75% (IQ3) | $60,316 | $60,032 |
| Interquartile Range (IQR) | $16,592 | $9,736 |
| Standard Deviation (Sample) | $23,247 | $15,271 |
| Standard Deviation (Population) | $23,098 | $15,058 |
Similar Demographics by Householder Income Under 25 years
Demographics Similar to Immigrants from Guyana by Householder Income Under 25 years
In terms of householder income under 25 years, the demographic groups most similar to Immigrants from Guyana are Immigrants from Greece ($55,727, a difference of 0.0%), Immigrants from Korea ($55,716, a difference of 0.020%), Immigrants from South Eastern Asia ($55,714, a difference of 0.020%), Immigrants from Belarus ($55,743, a difference of 0.030%), and Paraguayan ($55,614, a difference of 0.20%).
| Demographics | Rating | Rank | Householder Income Under 25 years |
| Immigrants | Japan | 100.0 /100 | #34 | Exceptional $55,932 |
| Tlingit-Haida | 100.0 /100 | #35 | Exceptional $55,914 |
| Immigrants | Israel | 100.0 /100 | #36 | Exceptional $55,913 |
| Immigrants | Russia | 100.0 /100 | #37 | Exceptional $55,891 |
| Immigrants | Iran | 100.0 /100 | #38 | Exceptional $55,880 |
| Immigrants | Belarus | 100.0 /100 | #39 | Exceptional $55,743 |
| Immigrants | Greece | 100.0 /100 | #40 | Exceptional $55,727 |
| Immigrants | Guyana | 100.0 /100 | #41 | Exceptional $55,726 |
| Immigrants | Korea | 100.0 /100 | #42 | Exceptional $55,716 |
| Immigrants | South Eastern Asia | 100.0 /100 | #43 | Exceptional $55,714 |
| Paraguayans | 100.0 /100 | #44 | Exceptional $55,614 |
| Spanish American Indians | 100.0 /100 | #45 | Exceptional $55,573 |
| Immigrants | Eastern Europe | 100.0 /100 | #46 | Exceptional $55,572 |
| Cambodians | 100.0 /100 | #47 | Exceptional $55,571 |
| Immigrants | Vietnam | 100.0 /100 | #48 | Exceptional $55,562 |
Demographics Similar to Swiss by Householder Income Under 25 years
In terms of householder income under 25 years, the demographic groups most similar to Swiss are Immigrants from Syria ($51,494, a difference of 0.0%), Pima ($51,503, a difference of 0.020%), Immigrants from West Indies ($51,479, a difference of 0.030%), British ($51,477, a difference of 0.030%), and Palestinian ($51,515, a difference of 0.040%).
| Demographics | Rating | Rank | Householder Income Under 25 years |
| West Indians | 18.5 /100 | #192 | Poor $51,583 |
| Immigrants | Eritrea | 18.1 /100 | #193 | Poor $51,574 |
| Guatemalans | 16.4 /100 | #194 | Poor $51,525 |
| Estonians | 16.4 /100 | #195 | Poor $51,523 |
| Palestinians | 16.1 /100 | #196 | Poor $51,515 |
| Pima | 15.7 /100 | #197 | Poor $51,503 |
| Immigrants | Syria | 15.4 /100 | #198 | Poor $51,494 |
| Swiss | 15.4 /100 | #199 | Poor $51,493 |
| Immigrants | West Indies | 14.9 /100 | #200 | Poor $51,479 |
| British | 14.9 /100 | #201 | Poor $51,477 |
| Immigrants | Guatemala | 14.0 /100 | #202 | Poor $51,447 |
| Immigrants | Cameroon | 13.6 /100 | #203 | Poor $51,433 |
| Czechs | 13.2 /100 | #204 | Poor $51,421 |
| Cape Verdeans | 12.3 /100 | #205 | Poor $51,387 |
| Immigrants | Latin America | 12.3 /100 | #206 | Poor $51,387 |