Tohono O'odham vs Swiss No Schooling Completed
COMPARE
Tohono O'odham
Swiss
No Schooling Completed
No Schooling Completed Comparison
Tohono O'odham
Swiss
2.3%
NO SCHOOLING COMPLETED
4.1/ 100
METRIC RATING
224th/ 347
METRIC RANK
1.5%
NO SCHOOLING COMPLETED
100.0/ 100
METRIC RATING
32nd/ 347
METRIC RANK
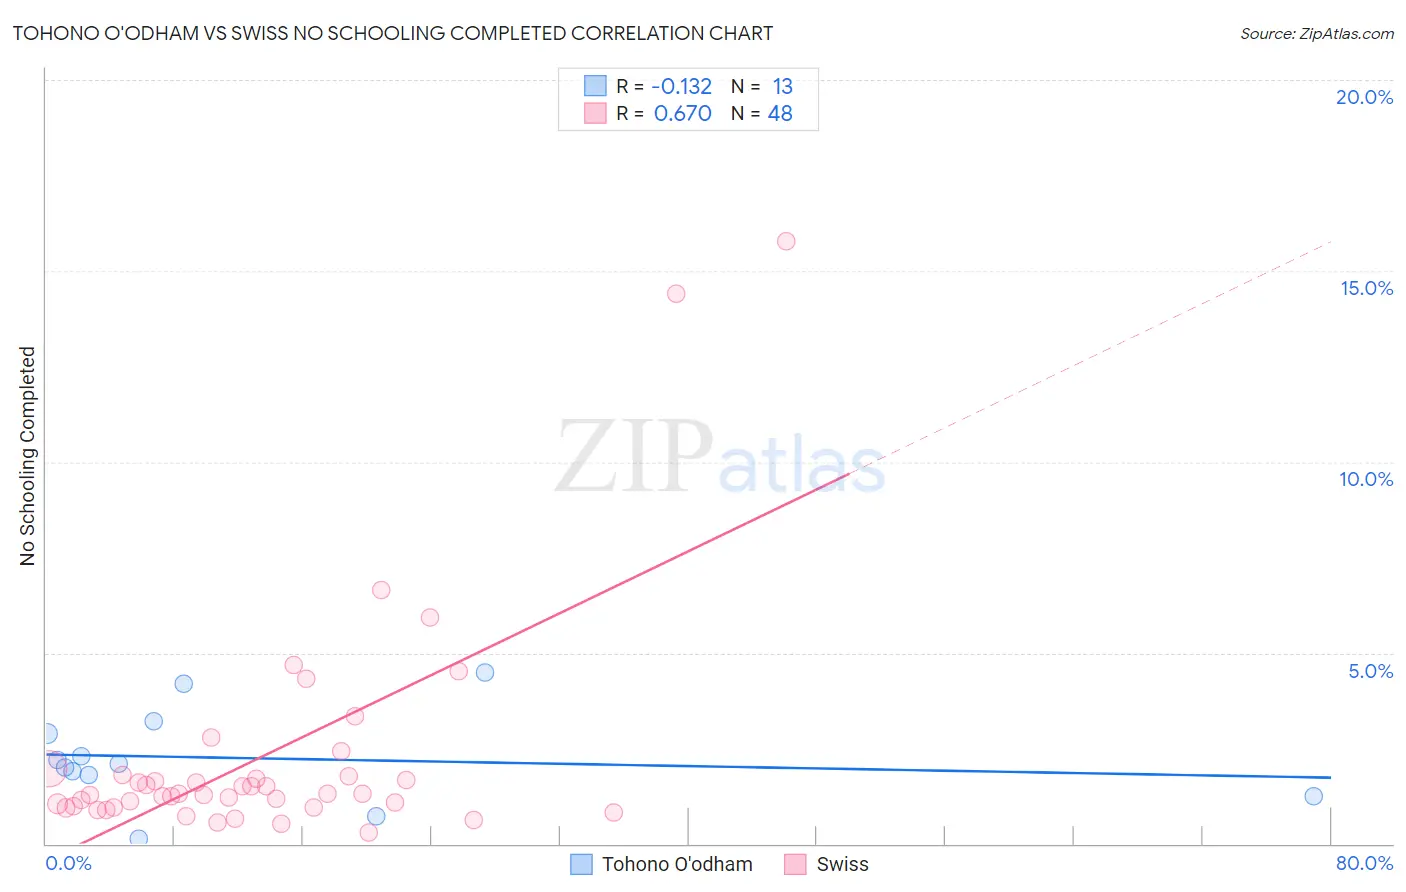
Tohono O'odham vs Swiss No Schooling Completed Correlation Chart
The statistical analysis conducted on geographies consisting of 58,626,316 people shows a poor negative correlation between the proportion of Tohono O'odham and percentage of population with no schooling in the United States with a correlation coefficient (R) of -0.132 and weighted average of 2.3%. Similarly, the statistical analysis conducted on geographies consisting of 455,291,102 people shows a significant positive correlation between the proportion of Swiss and percentage of population with no schooling in the United States with a correlation coefficient (R) of 0.670 and weighted average of 1.5%, a difference of 51.3%.
No Schooling Completed Correlation Summary
| Measurement | Tohono O'odham | Swiss |
| Minimum | 0.14% | 0.31% |
| Maximum | 4.5% | 15.8% |
| Range | 4.3% | 15.5% |
| Mean | 2.2% | 2.3% |
| Median | 2.1% | 1.3% |
| Interquartile 25% (IQ1) | 1.5% | 0.97% |
| Interquartile 75% (IQ3) | 3.1% | 1.8% |
| Interquartile Range (IQR) | 1.5% | 0.82% |
| Standard Deviation (Sample) | 1.2% | 3.0% |
| Standard Deviation (Population) | 1.2% | 3.0% |
Similar Demographics by No Schooling Completed
Demographics Similar to Tohono O'odham by No Schooling Completed
In terms of no schooling completed, the demographic groups most similar to Tohono O'odham are Sudanese (2.3%, a difference of 0.0%), Sierra Leonean (2.3%, a difference of 0.020%), Immigrants from Uganda (2.3%, a difference of 0.070%), Immigrants from Lebanon (2.3%, a difference of 0.29%), and U.S. Virgin Islander (2.3%, a difference of 0.36%).
| Demographics | Rating | Rank | No Schooling Completed |
| Immigrants | Syria | 6.6 /100 | #217 | Tragic 2.3% |
| Immigrants | Nepal | 6.4 /100 | #218 | Tragic 2.3% |
| Senegalese | 5.6 /100 | #219 | Tragic 2.3% |
| Immigrants | Costa Rica | 5.1 /100 | #220 | Tragic 2.3% |
| Immigrants | Sudan | 5.0 /100 | #221 | Tragic 2.3% |
| Sub-Saharan Africans | 4.7 /100 | #222 | Tragic 2.3% |
| Immigrants | Lebanon | 4.5 /100 | #223 | Tragic 2.3% |
| Tohono O'odham | 4.1 /100 | #224 | Tragic 2.3% |
| Sudanese | 4.1 /100 | #225 | Tragic 2.3% |
| Sierra Leoneans | 4.1 /100 | #226 | Tragic 2.3% |
| Immigrants | Uganda | 4.0 /100 | #227 | Tragic 2.3% |
| U.S. Virgin Islanders | 3.7 /100 | #228 | Tragic 2.3% |
| Immigrants | Pakistan | 3.6 /100 | #229 | Tragic 2.3% |
| Puerto Ricans | 3.4 /100 | #230 | Tragic 2.3% |
| Immigrants | Uruguay | 3.4 /100 | #231 | Tragic 2.3% |
Demographics Similar to Swiss by No Schooling Completed
In terms of no schooling completed, the demographic groups most similar to Swiss are Inupiat (1.5%, a difference of 0.39%), British (1.5%, a difference of 0.42%), Italian (1.5%, a difference of 0.68%), Lumbee (1.5%, a difference of 0.91%), and Latvian (1.5%, a difference of 0.94%).
| Demographics | Rating | Rank | No Schooling Completed |
| French | 100.0 /100 | #25 | Exceptional 1.5% |
| Czechs | 100.0 /100 | #26 | Exceptional 1.5% |
| Scandinavians | 100.0 /100 | #27 | Exceptional 1.5% |
| French Canadians | 100.0 /100 | #28 | Exceptional 1.5% |
| Lumbee | 100.0 /100 | #29 | Exceptional 1.5% |
| British | 100.0 /100 | #30 | Exceptional 1.5% |
| Inupiat | 100.0 /100 | #31 | Exceptional 1.5% |
| Swiss | 100.0 /100 | #32 | Exceptional 1.5% |
| Italians | 100.0 /100 | #33 | Exceptional 1.5% |
| Latvians | 100.0 /100 | #34 | Exceptional 1.5% |
| Eastern Europeans | 100.0 /100 | #35 | Exceptional 1.6% |
| Aleuts | 99.9 /100 | #36 | Exceptional 1.6% |
| Belgians | 99.9 /100 | #37 | Exceptional 1.6% |
| Northern Europeans | 99.9 /100 | #38 | Exceptional 1.6% |
| Native Hawaiians | 99.9 /100 | #39 | Exceptional 1.6% |