Tohono O'odham vs Black/African American Householder Income Under 25 years
COMPARE
Tohono O'odham
Black/African American
Householder Income Under 25 years
Householder Income Under 25 years Comparison
Tohono O'odham
Blacks/African Americans
$45,248
HOUSEHOLDER INCOME UNDER 25 YEARS
0.0/ 100
METRIC RATING
336th/ 347
METRIC RANK
$44,381
HOUSEHOLDER INCOME UNDER 25 YEARS
0.0/ 100
METRIC RATING
340th/ 347
METRIC RANK
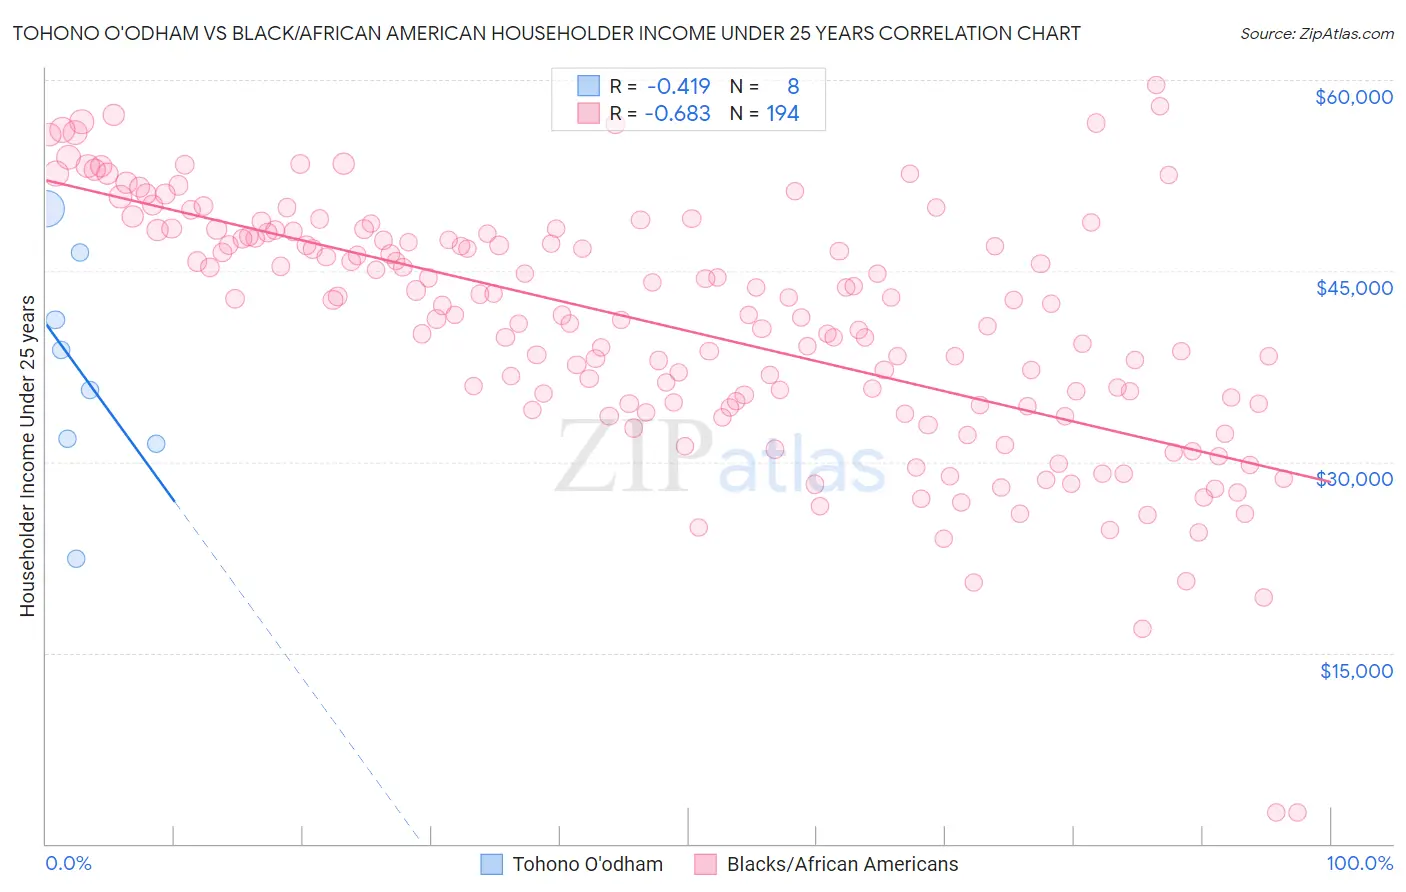
Tohono O'odham vs Black/African American Householder Income Under 25 years Correlation Chart
The statistical analysis conducted on geographies consisting of 56,811,547 people shows a moderate negative correlation between the proportion of Tohono O'odham and household income with householder under the age of 25 in the United States with a correlation coefficient (R) of -0.419 and weighted average of $45,248. Similarly, the statistical analysis conducted on geographies consisting of 438,583,318 people shows a significant negative correlation between the proportion of Blacks/African Americans and household income with householder under the age of 25 in the United States with a correlation coefficient (R) of -0.683 and weighted average of $44,381, a difference of 1.9%.
Householder Income Under 25 years Correlation Summary
| Measurement | Tohono O'odham | Black/African American |
| Minimum | $22,412 | $2,499 |
| Maximum | $49,920 | $59,638 |
| Range | $27,507 | $57,139 |
| Mean | $37,222 | $40,625 |
| Median | $37,258 | $41,554 |
| Interquartile 25% (IQ1) | $31,632 | $34,429 |
| Interquartile 75% (IQ3) | $43,831 | $47,684 |
| Interquartile Range (IQR) | $12,199 | $13,255 |
| Standard Deviation (Sample) | $8,859 | $9,747 |
| Standard Deviation (Population) | $8,287 | $9,722 |
Demographics Similar to Tohono O'odham and Blacks/African Americans by Householder Income Under 25 years
In terms of householder income under 25 years, the demographic groups most similar to Tohono O'odham are Cheyenne ($45,275, a difference of 0.060%), Cajun ($45,338, a difference of 0.20%), Creek ($45,371, a difference of 0.27%), Choctaw ($45,450, a difference of 0.45%), and Pueblo ($45,018, a difference of 0.51%). Similarly, the demographic groups most similar to Blacks/African Americans are Houma ($44,356, a difference of 0.060%), Kiowa ($44,733, a difference of 0.79%), Chickasaw ($44,763, a difference of 0.86%), Arapaho ($44,003, a difference of 0.86%), and Pueblo ($45,018, a difference of 1.4%).
| Demographics | Rating | Rank | Householder Income Under 25 years |
| German Russians | 0.0 /100 | #328 | Tragic $45,673 |
| Seminole | 0.0 /100 | #329 | Tragic $45,649 |
| Indonesians | 0.0 /100 | #330 | Tragic $45,566 |
| Immigrants | Zaire | 0.0 /100 | #331 | Tragic $45,529 |
| Choctaw | 0.0 /100 | #332 | Tragic $45,450 |
| Creek | 0.0 /100 | #333 | Tragic $45,371 |
| Cajuns | 0.0 /100 | #334 | Tragic $45,338 |
| Cheyenne | 0.0 /100 | #335 | Tragic $45,275 |
| Tohono O'odham | 0.0 /100 | #336 | Tragic $45,248 |
| Pueblo | 0.0 /100 | #337 | Tragic $45,018 |
| Chickasaw | 0.0 /100 | #338 | Tragic $44,763 |
| Kiowa | 0.0 /100 | #339 | Tragic $44,733 |
| Blacks/African Americans | 0.0 /100 | #340 | Tragic $44,381 |
| Houma | 0.0 /100 | #341 | Tragic $44,356 |
| Arapaho | 0.0 /100 | #342 | Tragic $44,003 |
| Immigrants | Yemen | 0.0 /100 | #343 | Tragic $43,591 |
| Immigrants | Congo | 0.0 /100 | #344 | Tragic $43,266 |
| Navajo | 0.0 /100 | #345 | Tragic $42,380 |
| Puerto Ricans | 0.0 /100 | #346 | Tragic $39,726 |
| Lumbee | 0.0 /100 | #347 | Tragic $34,584 |