Immigrants from Northern Europe vs Potawatomi Householder Income Over 65 years
COMPARE
Immigrants from Northern Europe
Potawatomi
Householder Income Over 65 years
Householder Income Over 65 years Comparison
Immigrants from Northern Europe
Potawatomi
$69,003
HOUSEHOLDER INCOME OVER 65 YEARS
100.0/ 100
METRIC RATING
30th/ 347
METRIC RANK
$54,212
HOUSEHOLDER INCOME OVER 65 YEARS
0.1/ 100
METRIC RATING
272nd/ 347
METRIC RANK
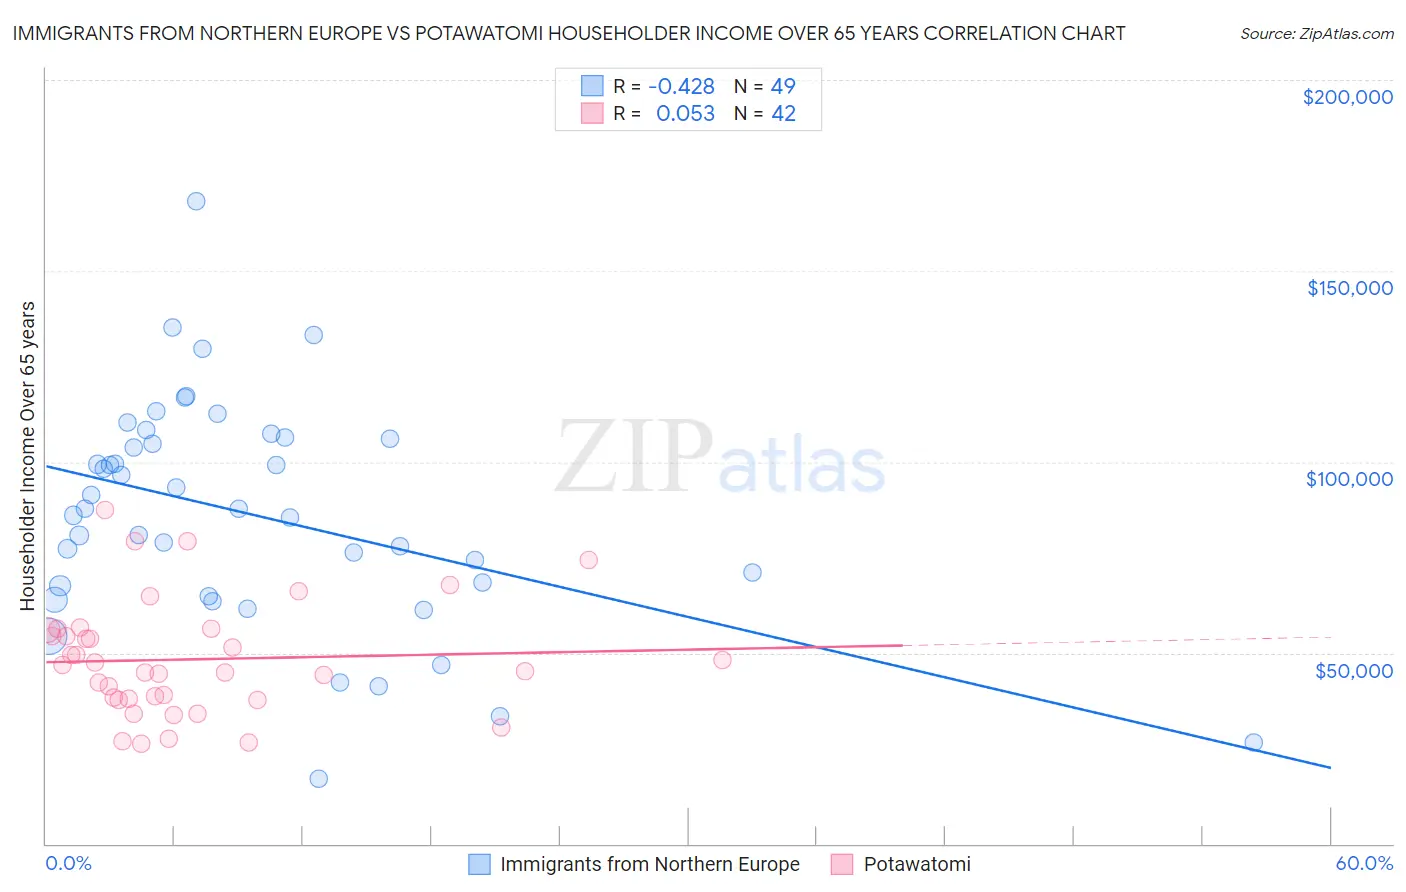
Immigrants from Northern Europe vs Potawatomi Householder Income Over 65 years Correlation Chart
The statistical analysis conducted on geographies consisting of 475,347,578 people shows a moderate negative correlation between the proportion of Immigrants from Northern Europe and household income with householder over the age of 65 in the United States with a correlation coefficient (R) of -0.428 and weighted average of $69,003. Similarly, the statistical analysis conducted on geographies consisting of 117,629,291 people shows a slight positive correlation between the proportion of Potawatomi and household income with householder over the age of 65 in the United States with a correlation coefficient (R) of 0.053 and weighted average of $54,212, a difference of 27.3%.
Householder Income Over 65 years Correlation Summary
| Measurement | Immigrants from Northern Europe | Potawatomi |
| Minimum | $16,875 | $26,199 |
| Maximum | $168,214 | $87,267 |
| Range | $151,339 | $61,068 |
| Mean | $86,244 | $48,291 |
| Median | $87,597 | $46,067 |
| Interquartile 25% (IQ1) | $66,142 | $38,035 |
| Interquartile 75% (IQ3) | $106,144 | $56,092 |
| Interquartile Range (IQR) | $40,003 | $18,057 |
| Standard Deviation (Sample) | $29,698 | $14,849 |
| Standard Deviation (Population) | $29,393 | $14,671 |
Similar Demographics by Householder Income Over 65 years
Demographics Similar to Immigrants from Northern Europe by Householder Income Over 65 years
In terms of householder income over 65 years, the demographic groups most similar to Immigrants from Northern Europe are Afghan ($68,951, a difference of 0.070%), Immigrants from Australia ($69,164, a difference of 0.23%), Immigrants from China ($69,174, a difference of 0.25%), Asian ($68,822, a difference of 0.26%), and Immigrants from Denmark ($68,801, a difference of 0.29%).
| Demographics | Rating | Rank | Householder Income Over 65 years |
| Immigrants | Japan | 100.0 /100 | #23 | Exceptional $69,774 |
| Immigrants | Sweden | 100.0 /100 | #24 | Exceptional $69,722 |
| Immigrants | Belgium | 100.0 /100 | #25 | Exceptional $69,703 |
| Immigrants | Sri Lanka | 100.0 /100 | #26 | Exceptional $69,426 |
| Immigrants | Switzerland | 100.0 /100 | #27 | Exceptional $69,343 |
| Immigrants | China | 100.0 /100 | #28 | Exceptional $69,174 |
| Immigrants | Australia | 100.0 /100 | #29 | Exceptional $69,164 |
| Immigrants | Northern Europe | 100.0 /100 | #30 | Exceptional $69,003 |
| Afghans | 100.0 /100 | #31 | Exceptional $68,951 |
| Asians | 100.0 /100 | #32 | Exceptional $68,822 |
| Immigrants | Denmark | 100.0 /100 | #33 | Exceptional $68,801 |
| Immigrants | Ireland | 100.0 /100 | #34 | Exceptional $68,495 |
| Tongans | 100.0 /100 | #35 | Exceptional $68,235 |
| Immigrants | Austria | 99.9 /100 | #36 | Exceptional $68,208 |
| Turks | 99.9 /100 | #37 | Exceptional $68,037 |
Demographics Similar to Potawatomi by Householder Income Over 65 years
In terms of householder income over 65 years, the demographic groups most similar to Potawatomi are Indonesian ($54,176, a difference of 0.070%), Barbadian ($54,163, a difference of 0.090%), Cherokee ($54,133, a difference of 0.15%), Cree ($54,129, a difference of 0.15%), and Cheyenne ($54,096, a difference of 0.21%).
| Demographics | Rating | Rank | Householder Income Over 65 years |
| Belizeans | 0.1 /100 | #265 | Tragic $54,580 |
| Jamaicans | 0.1 /100 | #266 | Tragic $54,560 |
| Guatemalans | 0.1 /100 | #267 | Tragic $54,526 |
| Immigrants | Zaire | 0.1 /100 | #268 | Tragic $54,512 |
| Nicaraguans | 0.1 /100 | #269 | Tragic $54,474 |
| Immigrants | Senegal | 0.1 /100 | #270 | Tragic $54,447 |
| Liberians | 0.1 /100 | #271 | Tragic $54,356 |
| Potawatomi | 0.1 /100 | #272 | Tragic $54,212 |
| Indonesians | 0.1 /100 | #273 | Tragic $54,176 |
| Barbadians | 0.1 /100 | #274 | Tragic $54,163 |
| Cherokee | 0.1 /100 | #275 | Tragic $54,133 |
| Cree | 0.1 /100 | #276 | Tragic $54,129 |
| Cheyenne | 0.1 /100 | #277 | Tragic $54,096 |
| Immigrants | Ecuador | 0.1 /100 | #278 | Tragic $54,030 |
| Blackfeet | 0.1 /100 | #279 | Tragic $54,029 |