Tlingit-Haida vs Finnish Receiving Food Stamps
COMPARE
Tlingit-Haida
Finnish
Receiving Food Stamps
Receiving Food Stamps Comparison
Tlingit-Haida
Finns
11.6%
RECEIVING FOOD STAMPS
59.1/ 100
METRIC RATING
168th/ 347
METRIC RANK
10.2%
RECEIVING FOOD STAMPS
97.9/ 100
METRIC RATING
90th/ 347
METRIC RANK
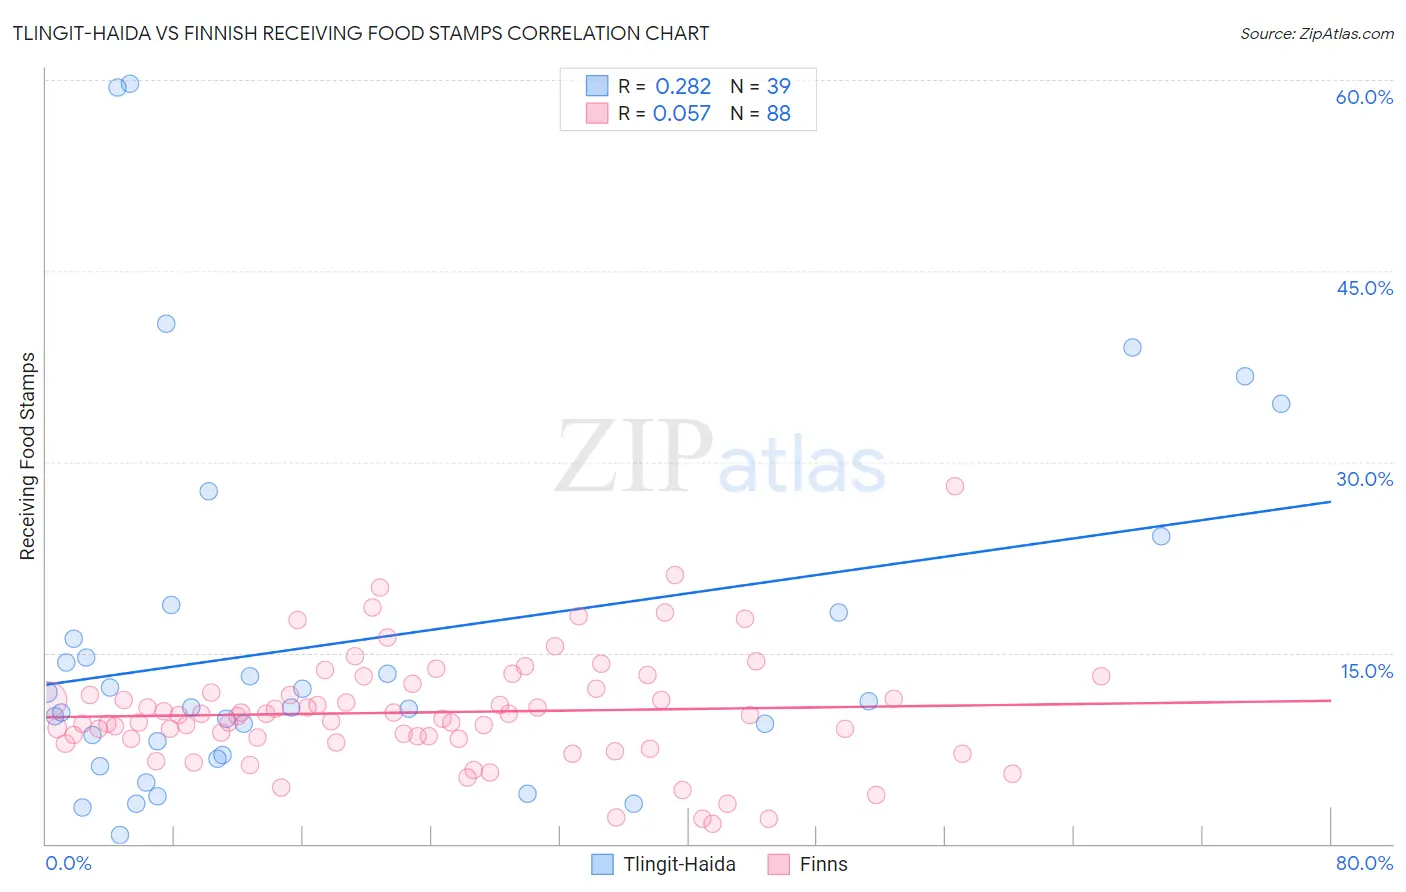
Tlingit-Haida vs Finnish Receiving Food Stamps Correlation Chart
The statistical analysis conducted on geographies consisting of 60,831,023 people shows a weak positive correlation between the proportion of Tlingit-Haida and percentage of population receiving government assistance and/or food stamps in the United States with a correlation coefficient (R) of 0.282 and weighted average of 11.6%. Similarly, the statistical analysis conducted on geographies consisting of 403,543,220 people shows a slight positive correlation between the proportion of Finns and percentage of population receiving government assistance and/or food stamps in the United States with a correlation coefficient (R) of 0.057 and weighted average of 10.2%, a difference of 14.1%.
Receiving Food Stamps Correlation Summary
| Measurement | Tlingit-Haida | Finnish |
| Minimum | 0.70% | 1.6% |
| Maximum | 59.7% | 28.1% |
| Range | 59.0% | 26.5% |
| Mean | 15.8% | 10.3% |
| Median | 10.7% | 10.0% |
| Interquartile 25% (IQ1) | 7.0% | 8.2% |
| Interquartile 75% (IQ3) | 18.2% | 12.0% |
| Interquartile Range (IQR) | 11.2% | 3.8% |
| Standard Deviation (Sample) | 14.4% | 4.4% |
| Standard Deviation (Population) | 14.2% | 4.4% |
Similar Demographics by Receiving Food Stamps
Demographics Similar to Tlingit-Haida by Receiving Food Stamps
In terms of receiving food stamps, the demographic groups most similar to Tlingit-Haida are Immigrants from Eastern Africa (11.6%, a difference of 0.12%), Kenyan (11.6%, a difference of 0.16%), Costa Rican (11.6%, a difference of 0.18%), Immigrants from Western Asia (11.6%, a difference of 0.40%), and Immigrants from Belarus (11.5%, a difference of 0.54%).
| Demographics | Rating | Rank | Receiving Food Stamps |
| Pennsylvania Germans | 68.4 /100 | #161 | Good 11.4% |
| Alsatians | 68.0 /100 | #162 | Good 11.4% |
| Immigrants | Southern Europe | 65.8 /100 | #163 | Good 11.5% |
| Immigrants | Chile | 65.0 /100 | #164 | Good 11.5% |
| Arabs | 64.7 /100 | #165 | Good 11.5% |
| Immigrants | Belarus | 62.8 /100 | #166 | Good 11.5% |
| Kenyans | 60.2 /100 | #167 | Good 11.6% |
| Tlingit-Haida | 59.1 /100 | #168 | Average 11.6% |
| Immigrants | Eastern Africa | 58.3 /100 | #169 | Average 11.6% |
| Costa Ricans | 57.9 /100 | #170 | Average 11.6% |
| Immigrants | Western Asia | 56.4 /100 | #171 | Average 11.6% |
| Guamanians/Chamorros | 54.2 /100 | #172 | Average 11.7% |
| Immigrants | Syria | 53.4 /100 | #173 | Average 11.7% |
| Immigrants | Eritrea | 50.0 /100 | #174 | Average 11.7% |
| Osage | 49.8 /100 | #175 | Average 11.7% |
Demographics Similar to Finns by Receiving Food Stamps
In terms of receiving food stamps, the demographic groups most similar to Finns are Jordanian (10.2%, a difference of 0.040%), Irish (10.2%, a difference of 0.040%), Belgian (10.2%, a difference of 0.42%), Immigrants from France (10.1%, a difference of 0.85%), and Immigrants from Greece (10.3%, a difference of 0.95%).
| Demographics | Rating | Rank | Receiving Food Stamps |
| Dutch | 98.6 /100 | #83 | Exceptional 10.0% |
| Immigrants | Israel | 98.5 /100 | #84 | Exceptional 10.0% |
| Immigrants | Romania | 98.5 /100 | #85 | Exceptional 10.0% |
| Immigrants | Norway | 98.4 /100 | #86 | Exceptional 10.0% |
| Egyptians | 98.4 /100 | #87 | Exceptional 10.0% |
| Immigrants | Kuwait | 98.4 /100 | #88 | Exceptional 10.0% |
| Immigrants | France | 98.3 /100 | #89 | Exceptional 10.1% |
| Finns | 97.9 /100 | #90 | Exceptional 10.2% |
| Jordanians | 97.9 /100 | #91 | Exceptional 10.2% |
| Irish | 97.9 /100 | #92 | Exceptional 10.2% |
| Belgians | 97.7 /100 | #93 | Exceptional 10.2% |
| Immigrants | Greece | 97.4 /100 | #94 | Exceptional 10.3% |
| Basques | 97.4 /100 | #95 | Exceptional 10.3% |
| Welsh | 97.3 /100 | #96 | Exceptional 10.3% |
| Czechoslovakians | 97.2 /100 | #97 | Exceptional 10.3% |