Syrian vs Immigrants from Croatia Median Household Income
COMPARE
Syrian
Immigrants from Croatia
Median Household Income
Median Household Income Comparison
Syrians
Immigrants from Croatia
$89,830
MEDIAN HOUSEHOLD INCOME
95.4/ 100
METRIC RATING
118th/ 347
METRIC RANK
$92,225
MEDIAN HOUSEHOLD INCOME
99.0/ 100
METRIC RATING
85th/ 347
METRIC RANK
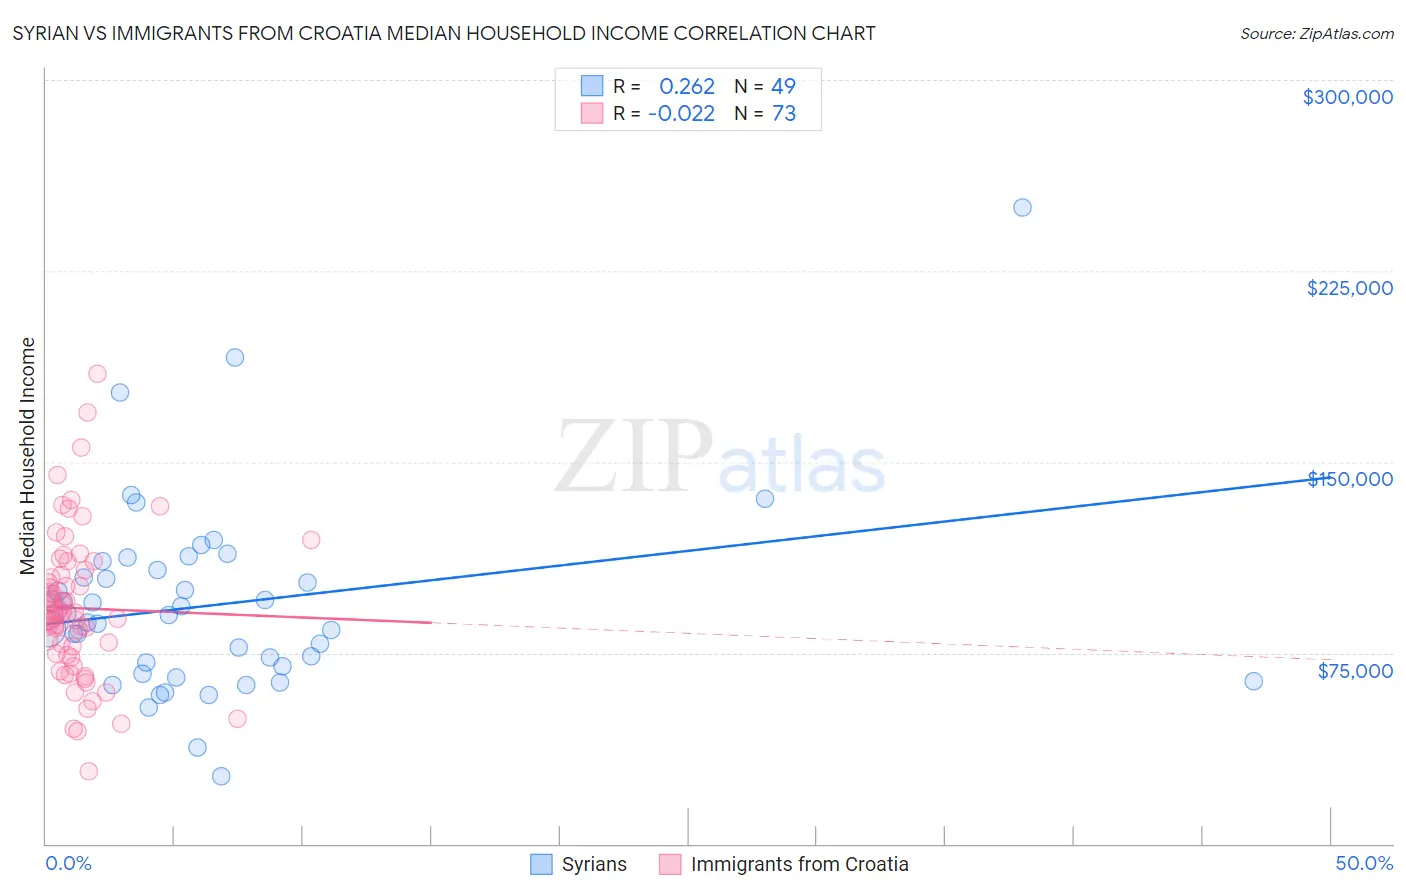
Syrian vs Immigrants from Croatia Median Household Income Correlation Chart
The statistical analysis conducted on geographies consisting of 266,119,923 people shows a weak positive correlation between the proportion of Syrians and median household income in the United States with a correlation coefficient (R) of 0.262 and weighted average of $89,830. Similarly, the statistical analysis conducted on geographies consisting of 132,561,989 people shows no correlation between the proportion of Immigrants from Croatia and median household income in the United States with a correlation coefficient (R) of -0.022 and weighted average of $92,225, a difference of 2.7%.
Median Household Income Correlation Summary
| Measurement | Syrian | Immigrants from Croatia |
| Minimum | $26,364 | $28,542 |
| Maximum | $250,001 | $184,569 |
| Range | $223,637 | $156,027 |
| Mean | $94,106 | $92,543 |
| Median | $89,903 | $90,687 |
| Interquartile 25% (IQ1) | $68,162 | $74,217 |
| Interquartile 75% (IQ3) | $109,343 | $106,459 |
| Interquartile Range (IQR) | $41,181 | $32,243 |
| Standard Deviation (Sample) | $38,336 | $28,654 |
| Standard Deviation (Population) | $37,943 | $28,457 |
Similar Demographics by Median Household Income
Demographics Similar to Syrians by Median Household Income
In terms of median household income, the demographic groups most similar to Syrians are Taiwanese ($89,900, a difference of 0.080%), Native Hawaiian ($89,919, a difference of 0.10%), Albanian ($89,744, a difference of 0.10%), Immigrants from North Macedonia ($89,741, a difference of 0.10%), and Immigrants from Western Asia ($90,005, a difference of 0.19%).
| Demographics | Rating | Rank | Median Household Income |
| Immigrants | Poland | 97.1 /100 | #111 | Exceptional $90,549 |
| Northern Europeans | 96.9 /100 | #112 | Exceptional $90,446 |
| Peruvians | 96.5 /100 | #113 | Exceptional $90,261 |
| Immigrants | Northern Africa | 95.9 /100 | #114 | Exceptional $90,026 |
| Immigrants | Western Asia | 95.9 /100 | #115 | Exceptional $90,005 |
| Native Hawaiians | 95.7 /100 | #116 | Exceptional $89,919 |
| Taiwanese | 95.6 /100 | #117 | Exceptional $89,900 |
| Syrians | 95.4 /100 | #118 | Exceptional $89,830 |
| Albanians | 95.2 /100 | #119 | Exceptional $89,744 |
| Immigrants | North Macedonia | 95.2 /100 | #120 | Exceptional $89,741 |
| Ethiopians | 94.9 /100 | #121 | Exceptional $89,640 |
| Pakistanis | 94.8 /100 | #122 | Exceptional $89,638 |
| Immigrants | Zimbabwe | 94.4 /100 | #123 | Exceptional $89,496 |
| Immigrants | Jordan | 94.1 /100 | #124 | Exceptional $89,412 |
| Immigrants | Kuwait | 93.5 /100 | #125 | Exceptional $89,263 |
Demographics Similar to Immigrants from Croatia by Median Household Income
In terms of median household income, the demographic groups most similar to Immigrants from Croatia are Immigrants from England ($92,098, a difference of 0.14%), Immigrants from Hungary ($92,094, a difference of 0.14%), Immigrants from Argentina ($92,417, a difference of 0.21%), Immigrants from Canada ($92,029, a difference of 0.21%), and Romanian ($91,994, a difference of 0.25%).
| Demographics | Rating | Rank | Median Household Income |
| Immigrants | Bulgaria | 99.4 /100 | #78 | Exceptional $93,148 |
| Sri Lankans | 99.4 /100 | #79 | Exceptional $93,093 |
| Tongans | 99.4 /100 | #80 | Exceptional $93,076 |
| Immigrants | Eastern Europe | 99.4 /100 | #81 | Exceptional $93,051 |
| Immigrants | Spain | 99.3 /100 | #82 | Exceptional $92,732 |
| Italians | 99.1 /100 | #83 | Exceptional $92,475 |
| Immigrants | Argentina | 99.1 /100 | #84 | Exceptional $92,417 |
| Immigrants | Croatia | 99.0 /100 | #85 | Exceptional $92,225 |
| Immigrants | England | 98.9 /100 | #86 | Exceptional $92,098 |
| Immigrants | Hungary | 98.9 /100 | #87 | Exceptional $92,094 |
| Immigrants | Canada | 98.8 /100 | #88 | Exceptional $92,029 |
| Romanians | 98.8 /100 | #89 | Exceptional $91,994 |
| Assyrians/Chaldeans/Syriacs | 98.8 /100 | #90 | Exceptional $91,991 |
| Immigrants | Vietnam | 98.8 /100 | #91 | Exceptional $91,987 |
| Immigrants | Western Europe | 98.8 /100 | #92 | Exceptional $91,936 |