Syrian vs Afghan Median Household Income
COMPARE
Syrian
Afghan
Median Household Income
Median Household Income Comparison
Syrians
Afghans
$89,830
MEDIAN HOUSEHOLD INCOME
95.4/ 100
METRIC RATING
118th/ 347
METRIC RANK
$97,026
MEDIAN HOUSEHOLD INCOME
100.0/ 100
METRIC RATING
39th/ 347
METRIC RANK
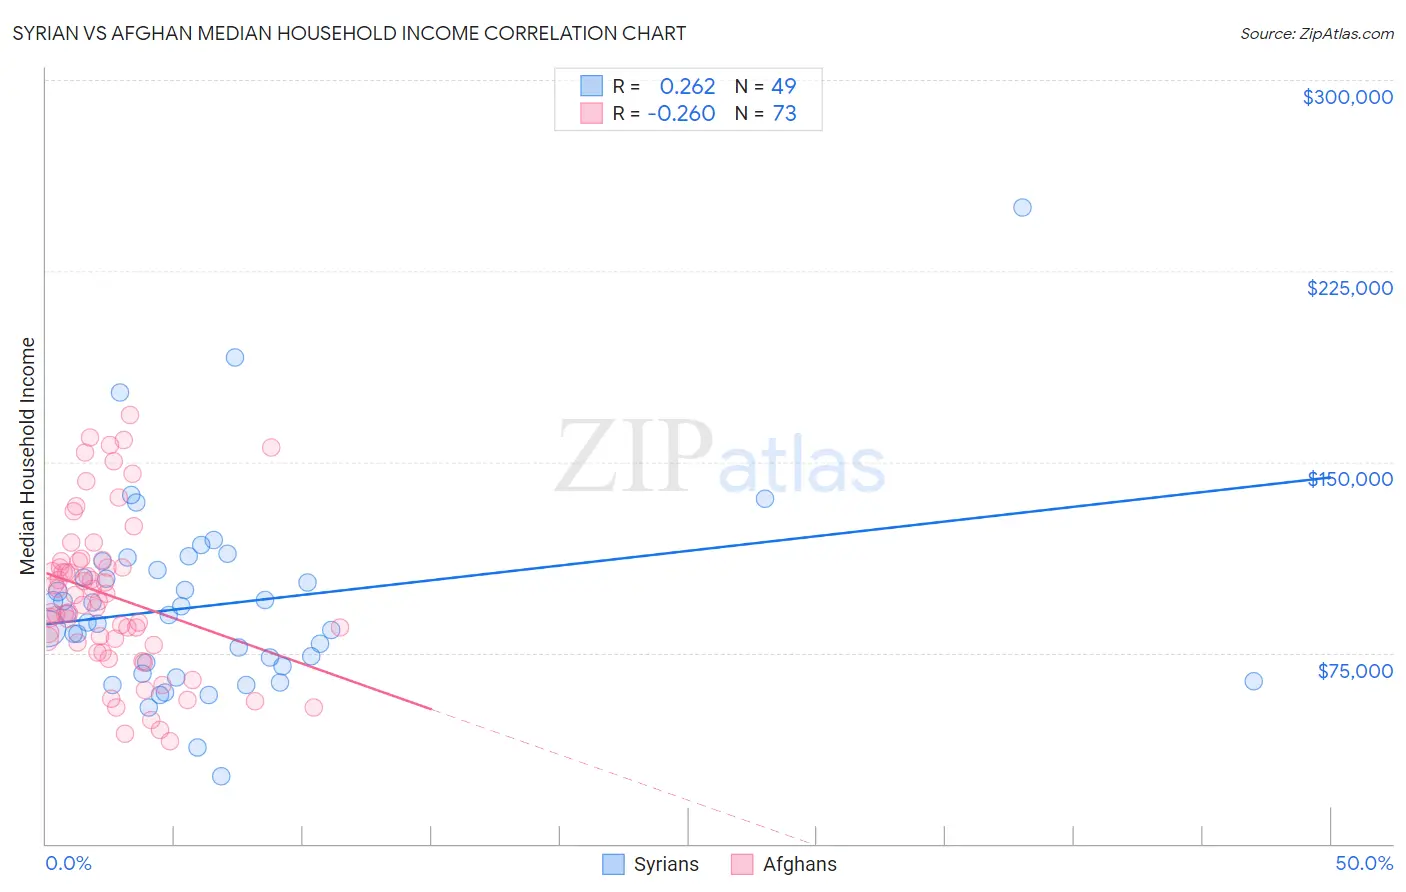
Syrian vs Afghan Median Household Income Correlation Chart
The statistical analysis conducted on geographies consisting of 266,119,923 people shows a weak positive correlation between the proportion of Syrians and median household income in the United States with a correlation coefficient (R) of 0.262 and weighted average of $89,830. Similarly, the statistical analysis conducted on geographies consisting of 148,820,759 people shows a weak negative correlation between the proportion of Afghans and median household income in the United States with a correlation coefficient (R) of -0.260 and weighted average of $97,026, a difference of 8.0%.
Median Household Income Correlation Summary
| Measurement | Syrian | Afghan |
| Minimum | $26,364 | $40,069 |
| Maximum | $250,001 | $168,646 |
| Range | $223,637 | $128,577 |
| Mean | $94,106 | $97,284 |
| Median | $89,903 | $95,399 |
| Interquartile 25% (IQ1) | $68,162 | $78,550 |
| Interquartile 75% (IQ3) | $109,343 | $110,861 |
| Interquartile Range (IQR) | $41,181 | $32,311 |
| Standard Deviation (Sample) | $38,336 | $30,429 |
| Standard Deviation (Population) | $37,943 | $30,220 |
Similar Demographics by Median Household Income
Demographics Similar to Syrians by Median Household Income
In terms of median household income, the demographic groups most similar to Syrians are Taiwanese ($89,900, a difference of 0.080%), Native Hawaiian ($89,919, a difference of 0.10%), Albanian ($89,744, a difference of 0.10%), Immigrants from North Macedonia ($89,741, a difference of 0.10%), and Immigrants from Western Asia ($90,005, a difference of 0.19%).
| Demographics | Rating | Rank | Median Household Income |
| Immigrants | Poland | 97.1 /100 | #111 | Exceptional $90,549 |
| Northern Europeans | 96.9 /100 | #112 | Exceptional $90,446 |
| Peruvians | 96.5 /100 | #113 | Exceptional $90,261 |
| Immigrants | Northern Africa | 95.9 /100 | #114 | Exceptional $90,026 |
| Immigrants | Western Asia | 95.9 /100 | #115 | Exceptional $90,005 |
| Native Hawaiians | 95.7 /100 | #116 | Exceptional $89,919 |
| Taiwanese | 95.6 /100 | #117 | Exceptional $89,900 |
| Syrians | 95.4 /100 | #118 | Exceptional $89,830 |
| Albanians | 95.2 /100 | #119 | Exceptional $89,744 |
| Immigrants | North Macedonia | 95.2 /100 | #120 | Exceptional $89,741 |
| Ethiopians | 94.9 /100 | #121 | Exceptional $89,640 |
| Pakistanis | 94.8 /100 | #122 | Exceptional $89,638 |
| Immigrants | Zimbabwe | 94.4 /100 | #123 | Exceptional $89,496 |
| Immigrants | Jordan | 94.1 /100 | #124 | Exceptional $89,412 |
| Immigrants | Kuwait | 93.5 /100 | #125 | Exceptional $89,263 |
Demographics Similar to Afghans by Median Household Income
In terms of median household income, the demographic groups most similar to Afghans are Maltese ($97,015, a difference of 0.010%), Immigrants from Turkey ($96,964, a difference of 0.060%), Immigrants from Lithuania ($96,836, a difference of 0.20%), Immigrants from Indonesia ($97,297, a difference of 0.28%), and Latvian ($97,311, a difference of 0.29%).
| Demographics | Rating | Rank | Median Household Income |
| Immigrants | Denmark | 100.0 /100 | #32 | Exceptional $98,510 |
| Chinese | 100.0 /100 | #33 | Exceptional $98,496 |
| Russians | 100.0 /100 | #34 | Exceptional $98,008 |
| Immigrants | Switzerland | 100.0 /100 | #35 | Exceptional $97,979 |
| Immigrants | Pakistan | 100.0 /100 | #36 | Exceptional $97,528 |
| Latvians | 100.0 /100 | #37 | Exceptional $97,311 |
| Immigrants | Indonesia | 100.0 /100 | #38 | Exceptional $97,297 |
| Afghans | 100.0 /100 | #39 | Exceptional $97,026 |
| Maltese | 100.0 /100 | #40 | Exceptional $97,015 |
| Immigrants | Turkey | 100.0 /100 | #41 | Exceptional $96,964 |
| Immigrants | Lithuania | 99.9 /100 | #42 | Exceptional $96,836 |
| Immigrants | France | 99.9 /100 | #43 | Exceptional $96,743 |
| Immigrants | Greece | 99.9 /100 | #44 | Exceptional $96,675 |
| Israelis | 99.9 /100 | #45 | Exceptional $96,552 |
| Australians | 99.9 /100 | #46 | Exceptional $96,490 |