Swedish vs Ugandan Median Household Income
COMPARE
Swedish
Ugandan
Median Household Income
Median Household Income Comparison
Swedes
Ugandans
$88,524
MEDIAN HOUSEHOLD INCOME
90.0/ 100
METRIC RATING
134th/ 347
METRIC RANK
$87,557
MEDIAN HOUSEHOLD INCOME
82.9/ 100
METRIC RATING
145th/ 347
METRIC RANK
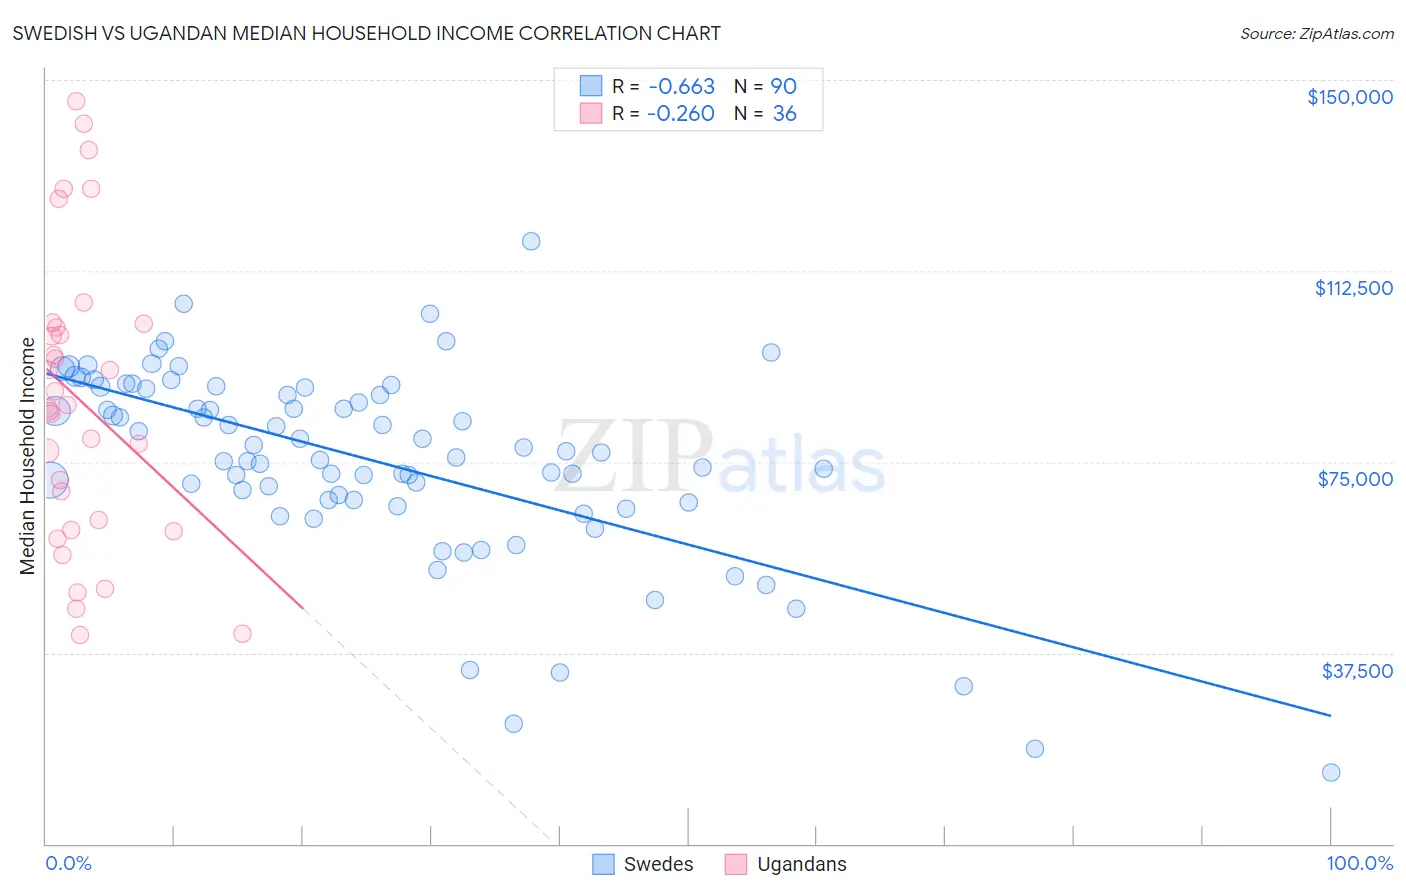
Swedish vs Ugandan Median Household Income Correlation Chart
The statistical analysis conducted on geographies consisting of 538,472,836 people shows a significant negative correlation between the proportion of Swedes and median household income in the United States with a correlation coefficient (R) of -0.663 and weighted average of $88,524. Similarly, the statistical analysis conducted on geographies consisting of 93,988,402 people shows a weak negative correlation between the proportion of Ugandans and median household income in the United States with a correlation coefficient (R) of -0.260 and weighted average of $87,557, a difference of 1.1%.
Median Household Income Correlation Summary
| Measurement | Swedish | Ugandan |
| Minimum | $14,107 | $40,977 |
| Maximum | $118,333 | $145,769 |
| Range | $104,226 | $104,792 |
| Mean | $75,217 | $87,043 |
| Median | $76,969 | $85,898 |
| Interquartile 25% (IQ1) | $67,408 | $62,590 |
| Interquartile 75% (IQ3) | $89,464 | $101,783 |
| Interquartile Range (IQR) | $22,056 | $39,193 |
| Standard Deviation (Sample) | $18,981 | $28,515 |
| Standard Deviation (Population) | $18,875 | $28,116 |
Demographics Similar to Swedes and Ugandans by Median Household Income
In terms of median household income, the demographic groups most similar to Swedes are Immigrants from Sierra Leone ($88,498, a difference of 0.030%), Polish ($88,472, a difference of 0.060%), Sierra Leonean ($88,463, a difference of 0.070%), Arab ($88,398, a difference of 0.14%), and Immigrants from Chile ($88,388, a difference of 0.15%). Similarly, the demographic groups most similar to Ugandans are Immigrants from Uganda ($87,553, a difference of 0.0%), Serbian ($87,572, a difference of 0.020%), South American Indian ($87,446, a difference of 0.13%), Danish ($87,676, a difference of 0.14%), and Canadian ($87,769, a difference of 0.24%).
| Demographics | Rating | Rank | Median Household Income |
| Brazilians | 92.1 /100 | #129 | Exceptional $88,934 |
| British | 92.0 /100 | #130 | Exceptional $88,914 |
| Immigrants | Syria | 91.4 /100 | #131 | Exceptional $88,792 |
| Europeans | 91.2 /100 | #132 | Exceptional $88,751 |
| Immigrants | Ethiopia | 90.9 /100 | #133 | Exceptional $88,687 |
| Swedes | 90.0 /100 | #134 | Exceptional $88,524 |
| Immigrants | Sierra Leone | 89.9 /100 | #135 | Excellent $88,498 |
| Poles | 89.7 /100 | #136 | Excellent $88,472 |
| Sierra Leoneans | 89.6 /100 | #137 | Excellent $88,463 |
| Arabs | 89.2 /100 | #138 | Excellent $88,398 |
| Immigrants | Chile | 89.2 /100 | #139 | Excellent $88,388 |
| Lebanese | 87.2 /100 | #140 | Excellent $88,091 |
| Immigrants | Morocco | 86.0 /100 | #141 | Excellent $87,930 |
| Canadians | 84.7 /100 | #142 | Excellent $87,769 |
| Danes | 83.9 /100 | #143 | Excellent $87,676 |
| Serbians | 83.0 /100 | #144 | Excellent $87,572 |
| Ugandans | 82.9 /100 | #145 | Excellent $87,557 |
| Immigrants | Uganda | 82.8 /100 | #146 | Excellent $87,553 |
| South American Indians | 81.8 /100 | #147 | Excellent $87,446 |
| Costa Ricans | 80.0 /100 | #148 | Excellent $87,262 |
| Immigrants | Nepal | 77.7 /100 | #149 | Good $87,046 |