Immigrants from Oceania vs Ugandan Median Household Income
COMPARE
Immigrants from Oceania
Ugandan
Median Household Income
Median Household Income Comparison
Immigrants from Oceania
Ugandans
$89,100
MEDIAN HOUSEHOLD INCOME
92.9/ 100
METRIC RATING
126th/ 347
METRIC RANK
$87,557
MEDIAN HOUSEHOLD INCOME
82.9/ 100
METRIC RATING
145th/ 347
METRIC RANK
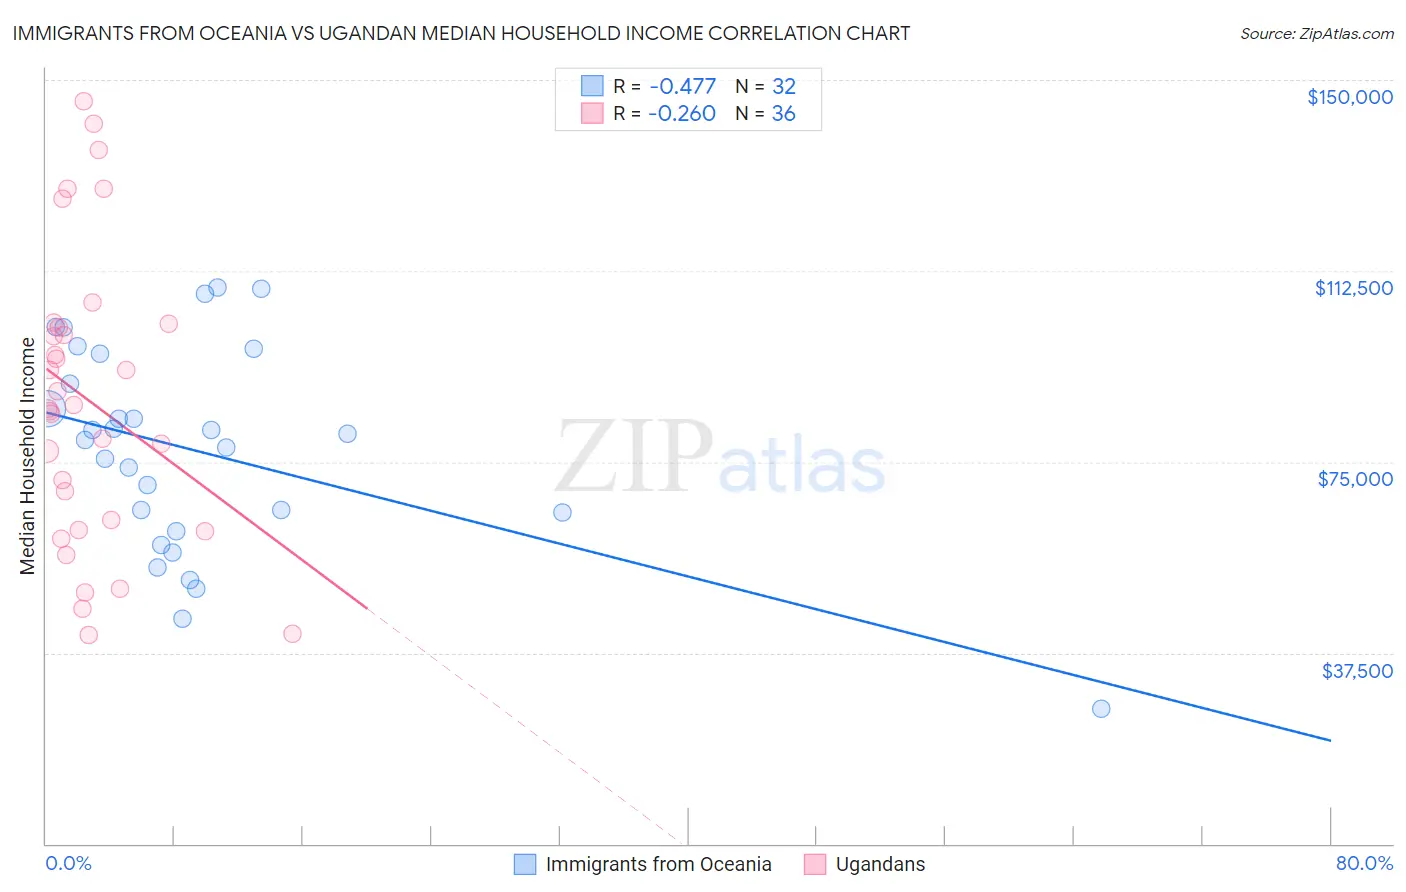
Immigrants from Oceania vs Ugandan Median Household Income Correlation Chart
The statistical analysis conducted on geographies consisting of 305,340,910 people shows a moderate negative correlation between the proportion of Immigrants from Oceania and median household income in the United States with a correlation coefficient (R) of -0.477 and weighted average of $89,100. Similarly, the statistical analysis conducted on geographies consisting of 93,988,402 people shows a weak negative correlation between the proportion of Ugandans and median household income in the United States with a correlation coefficient (R) of -0.260 and weighted average of $87,557, a difference of 1.8%.
Median Household Income Correlation Summary
| Measurement | Immigrants from Oceania | Ugandan |
| Minimum | $26,558 | $40,977 |
| Maximum | $109,241 | $145,769 |
| Range | $82,683 | $104,792 |
| Mean | $77,019 | $87,043 |
| Median | $80,011 | $85,898 |
| Interquartile 25% (IQ1) | $63,155 | $62,590 |
| Interquartile 75% (IQ3) | $93,329 | $101,783 |
| Interquartile Range (IQR) | $30,174 | $39,193 |
| Standard Deviation (Sample) | $20,295 | $28,515 |
| Standard Deviation (Population) | $19,975 | $28,116 |
Demographics Similar to Immigrants from Oceania and Ugandans by Median Household Income
In terms of median household income, the demographic groups most similar to Immigrants from Oceania are Immigrants from Peru ($89,010, a difference of 0.10%), Portuguese ($88,976, a difference of 0.14%), Immigrants from Kuwait ($89,263, a difference of 0.18%), Brazilian ($88,934, a difference of 0.19%), and British ($88,914, a difference of 0.21%). Similarly, the demographic groups most similar to Ugandans are Serbian ($87,572, a difference of 0.020%), Danish ($87,676, a difference of 0.14%), Canadian ($87,769, a difference of 0.24%), Immigrants from Morocco ($87,930, a difference of 0.43%), and Lebanese ($88,091, a difference of 0.61%).
| Demographics | Rating | Rank | Median Household Income |
| Immigrants | Kuwait | 93.5 /100 | #125 | Exceptional $89,263 |
| Immigrants | Oceania | 92.9 /100 | #126 | Exceptional $89,100 |
| Immigrants | Peru | 92.5 /100 | #127 | Exceptional $89,010 |
| Portuguese | 92.3 /100 | #128 | Exceptional $88,976 |
| Brazilians | 92.1 /100 | #129 | Exceptional $88,934 |
| British | 92.0 /100 | #130 | Exceptional $88,914 |
| Immigrants | Syria | 91.4 /100 | #131 | Exceptional $88,792 |
| Europeans | 91.2 /100 | #132 | Exceptional $88,751 |
| Immigrants | Ethiopia | 90.9 /100 | #133 | Exceptional $88,687 |
| Swedes | 90.0 /100 | #134 | Exceptional $88,524 |
| Immigrants | Sierra Leone | 89.9 /100 | #135 | Excellent $88,498 |
| Poles | 89.7 /100 | #136 | Excellent $88,472 |
| Sierra Leoneans | 89.6 /100 | #137 | Excellent $88,463 |
| Arabs | 89.2 /100 | #138 | Excellent $88,398 |
| Immigrants | Chile | 89.2 /100 | #139 | Excellent $88,388 |
| Lebanese | 87.2 /100 | #140 | Excellent $88,091 |
| Immigrants | Morocco | 86.0 /100 | #141 | Excellent $87,930 |
| Canadians | 84.7 /100 | #142 | Excellent $87,769 |
| Danes | 83.9 /100 | #143 | Excellent $87,676 |
| Serbians | 83.0 /100 | #144 | Excellent $87,572 |
| Ugandans | 82.9 /100 | #145 | Excellent $87,557 |