Sudanese vs Immigrants from Italy Hearing Disability
COMPARE
Sudanese
Immigrants from Italy
Hearing Disability
Hearing Disability Comparison
Sudanese
Immigrants from Italy
2.9%
HEARING DISABILITY
72.1/ 100
METRIC RATING
153rd/ 347
METRIC RANK
3.0%
HEARING DISABILITY
41.1/ 100
METRIC RATING
182nd/ 347
METRIC RANK
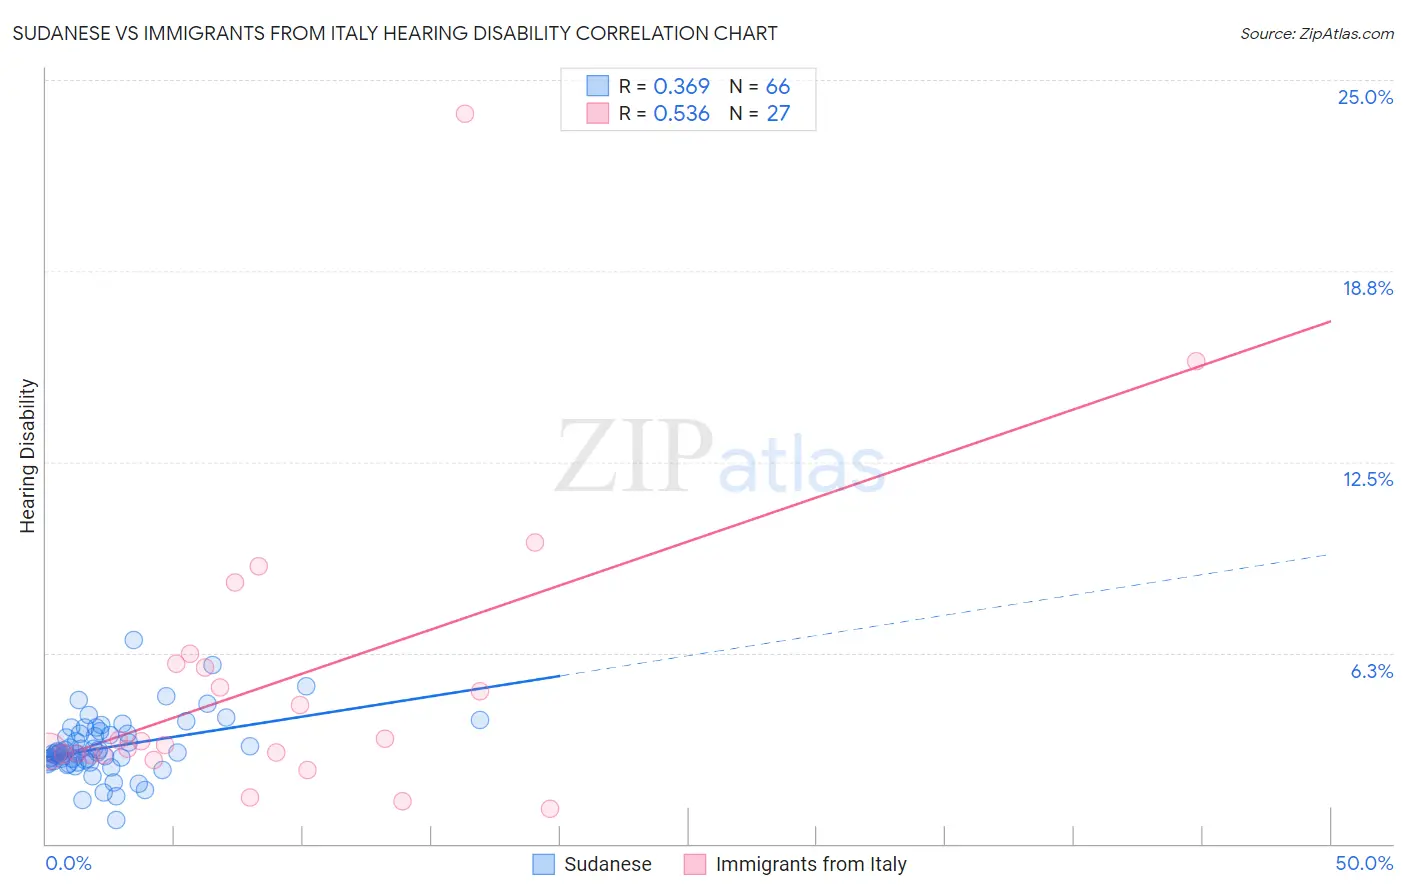
Sudanese vs Immigrants from Italy Hearing Disability Correlation Chart
The statistical analysis conducted on geographies consisting of 110,125,850 people shows a mild positive correlation between the proportion of Sudanese and percentage of population with hearing disability in the United States with a correlation coefficient (R) of 0.369 and weighted average of 2.9%. Similarly, the statistical analysis conducted on geographies consisting of 324,155,277 people shows a substantial positive correlation between the proportion of Immigrants from Italy and percentage of population with hearing disability in the United States with a correlation coefficient (R) of 0.536 and weighted average of 3.0%, a difference of 3.1%.
Hearing Disability Correlation Summary
| Measurement | Sudanese | Immigrants from Italy |
| Minimum | 0.77% | 1.1% |
| Maximum | 6.7% | 23.9% |
| Range | 5.9% | 22.8% |
| Mean | 3.2% | 5.3% |
| Median | 3.0% | 3.3% |
| Interquartile 25% (IQ1) | 2.7% | 2.9% |
| Interquartile 75% (IQ3) | 3.6% | 5.9% |
| Interquartile Range (IQR) | 0.92% | 3.0% |
| Standard Deviation (Sample) | 0.97% | 4.9% |
| Standard Deviation (Population) | 0.96% | 4.8% |
Similar Demographics by Hearing Disability
Demographics Similar to Sudanese by Hearing Disability
In terms of hearing disability, the demographic groups most similar to Sudanese are Immigrants from Lebanon (2.9%, a difference of 0.070%), Costa Rican (2.9%, a difference of 0.090%), Immigrants from Lithuania (2.9%, a difference of 0.11%), Immigrants from France (2.9%, a difference of 0.12%), and Palestinian (2.9%, a difference of 0.18%).
| Demographics | Rating | Rank | Hearing Disability |
| Brazilians | 78.7 /100 | #146 | Good 2.9% |
| Tongans | 78.6 /100 | #147 | Good 2.9% |
| Immigrants | Russia | 77.7 /100 | #148 | Good 2.9% |
| Immigrants | Panama | 76.9 /100 | #149 | Good 2.9% |
| Palestinians | 73.6 /100 | #150 | Good 2.9% |
| Immigrants | France | 73.1 /100 | #151 | Good 2.9% |
| Immigrants | Lithuania | 73.0 /100 | #152 | Good 2.9% |
| Sudanese | 72.1 /100 | #153 | Good 2.9% |
| Immigrants | Lebanon | 71.5 /100 | #154 | Good 2.9% |
| Costa Ricans | 71.4 /100 | #155 | Good 2.9% |
| Immigrants | Poland | 70.2 /100 | #156 | Good 2.9% |
| Immigrants | Kazakhstan | 69.6 /100 | #157 | Good 2.9% |
| Immigrants | Burma/Myanmar | 69.5 /100 | #158 | Good 2.9% |
| Immigrants | Australia | 67.4 /100 | #159 | Good 2.9% |
| Immigrants | Fiji | 67.1 /100 | #160 | Good 2.9% |
Demographics Similar to Immigrants from Italy by Hearing Disability
In terms of hearing disability, the demographic groups most similar to Immigrants from Italy are Immigrants from Belgium (3.0%, a difference of 0.030%), Immigrants from Sweden (3.0%, a difference of 0.12%), Bulgarian (3.0%, a difference of 0.14%), Immigrants from Moldova (3.0%, a difference of 0.18%), and Immigrants from Ireland (3.0%, a difference of 0.37%).
| Demographics | Rating | Rank | Hearing Disability |
| Immigrants | Romania | 48.4 /100 | #175 | Average 3.0% |
| Panamanians | 47.0 /100 | #176 | Average 3.0% |
| Immigrants | Philippines | 46.4 /100 | #177 | Average 3.0% |
| Japanese | 46.0 /100 | #178 | Average 3.0% |
| Immigrants | Moldova | 43.1 /100 | #179 | Average 3.0% |
| Immigrants | Sweden | 42.4 /100 | #180 | Average 3.0% |
| Immigrants | Belgium | 41.5 /100 | #181 | Average 3.0% |
| Immigrants | Italy | 41.1 /100 | #182 | Average 3.0% |
| Bulgarians | 39.7 /100 | #183 | Fair 3.0% |
| Immigrants | Ireland | 37.4 /100 | #184 | Fair 3.0% |
| Immigrants | Southern Europe | 35.3 /100 | #185 | Fair 3.0% |
| Immigrants | Mexico | 34.9 /100 | #186 | Fair 3.0% |
| Blacks/African Americans | 34.7 /100 | #187 | Fair 3.0% |
| Mexican American Indians | 34.7 /100 | #188 | Fair 3.0% |
| Africans | 32.9 /100 | #189 | Fair 3.0% |