Sudanese vs Immigrants from Italy Disability
COMPARE
Sudanese
Immigrants from Italy
Disability
Disability Comparison
Sudanese
Immigrants from Italy
11.5%
DISABILITY
77.1/ 100
METRIC RATING
148th/ 347
METRIC RANK
11.4%
DISABILITY
90.4/ 100
METRIC RATING
127th/ 347
METRIC RANK
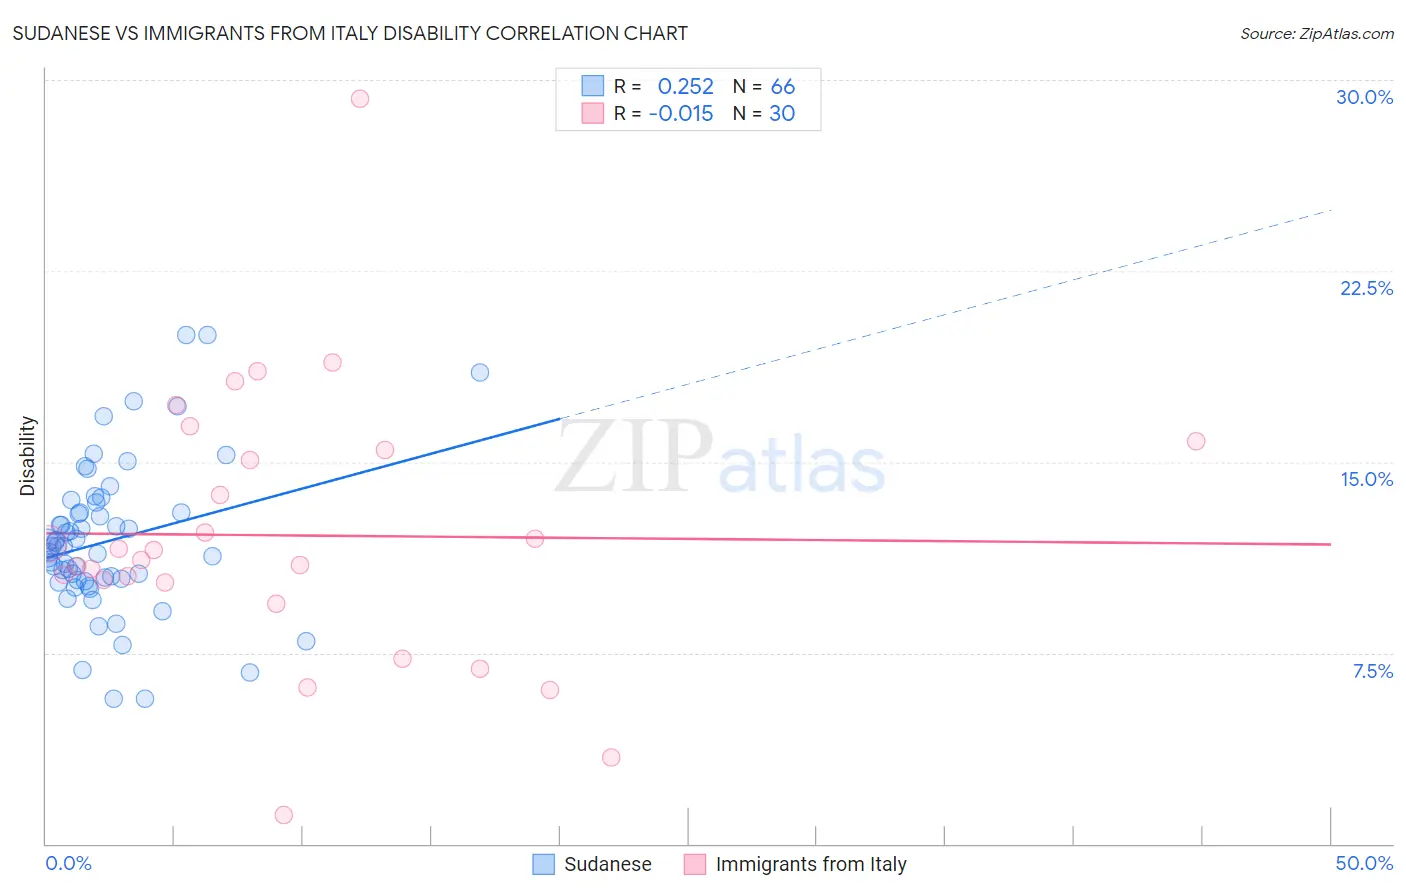
Sudanese vs Immigrants from Italy Disability Correlation Chart
The statistical analysis conducted on geographies consisting of 110,141,954 people shows a weak positive correlation between the proportion of Sudanese and percentage of population with a disability in the United States with a correlation coefficient (R) of 0.252 and weighted average of 11.5%. Similarly, the statistical analysis conducted on geographies consisting of 324,217,000 people shows no correlation between the proportion of Immigrants from Italy and percentage of population with a disability in the United States with a correlation coefficient (R) of -0.015 and weighted average of 11.4%, a difference of 1.2%.
Disability Correlation Summary
| Measurement | Sudanese | Immigrants from Italy |
| Minimum | 5.7% | 1.2% |
| Maximum | 20.0% | 29.3% |
| Range | 14.3% | 28.1% |
| Mean | 11.9% | 12.1% |
| Median | 11.7% | 11.3% |
| Interquartile 25% (IQ1) | 10.3% | 10.2% |
| Interquartile 75% (IQ3) | 13.0% | 15.4% |
| Interquartile Range (IQR) | 2.7% | 5.2% |
| Standard Deviation (Sample) | 2.9% | 5.4% |
| Standard Deviation (Population) | 2.9% | 5.3% |
Similar Demographics by Disability
Demographics Similar to Sudanese by Disability
In terms of disability, the demographic groups most similar to Sudanese are Immigrants from Ukraine (11.5%, a difference of 0.030%), Immigrants from Hungary (11.5%, a difference of 0.12%), Immigrants from Norway (11.6%, a difference of 0.24%), Romanian (11.6%, a difference of 0.27%), and Nigerian (11.5%, a difference of 0.29%).
| Demographics | Rating | Rank | Disability |
| Immigrants | Grenada | 86.1 /100 | #141 | Excellent 11.5% |
| Immigrants | Sudan | 85.3 /100 | #142 | Excellent 11.5% |
| Moroccans | 83.3 /100 | #143 | Excellent 11.5% |
| Australians | 82.5 /100 | #144 | Excellent 11.5% |
| Nigerians | 81.3 /100 | #145 | Excellent 11.5% |
| Immigrants | Hungary | 79.0 /100 | #146 | Good 11.5% |
| Immigrants | Ukraine | 77.6 /100 | #147 | Good 11.5% |
| Sudanese | 77.1 /100 | #148 | Good 11.5% |
| Immigrants | Norway | 73.2 /100 | #149 | Good 11.6% |
| Romanians | 72.7 /100 | #150 | Good 11.6% |
| Immigrants | Kenya | 72.1 /100 | #151 | Good 11.6% |
| Immigrants | Moldova | 72.0 /100 | #152 | Good 11.6% |
| Immigrants | Ghana | 71.2 /100 | #153 | Good 11.6% |
| Immigrants | Guatemala | 71.1 /100 | #154 | Good 11.6% |
| Immigrants | Netherlands | 69.8 /100 | #155 | Good 11.6% |
Demographics Similar to Immigrants from Italy by Disability
In terms of disability, the demographic groups most similar to Immigrants from Italy are Immigrants from Europe (11.4%, a difference of 0.0%), Macedonian (11.4%, a difference of 0.020%), Immigrants from Latvia (11.4%, a difference of 0.070%), Latvian (11.4%, a difference of 0.070%), and Immigrants from Croatia (11.4%, a difference of 0.080%).
| Demographics | Rating | Rank | Disability |
| Immigrants | North Macedonia | 93.5 /100 | #120 | Exceptional 11.4% |
| Immigrants | Costa Rica | 93.4 /100 | #121 | Exceptional 11.4% |
| Brazilians | 93.3 /100 | #122 | Exceptional 11.4% |
| South Africans | 92.3 /100 | #123 | Exceptional 11.4% |
| South American Indians | 92.2 /100 | #124 | Exceptional 11.4% |
| Costa Ricans | 91.9 /100 | #125 | Exceptional 11.4% |
| Immigrants | Latvia | 90.9 /100 | #126 | Exceptional 11.4% |
| Immigrants | Italy | 90.4 /100 | #127 | Exceptional 11.4% |
| Immigrants | Europe | 90.4 /100 | #128 | Exceptional 11.4% |
| Macedonians | 90.3 /100 | #129 | Exceptional 11.4% |
| Latvians | 89.8 /100 | #130 | Excellent 11.4% |
| Immigrants | Croatia | 89.8 /100 | #131 | Excellent 11.4% |
| Immigrants | Africa | 89.3 /100 | #132 | Excellent 11.4% |
| Arabs | 89.1 /100 | #133 | Excellent 11.4% |
| Immigrants | Guyana | 88.3 /100 | #134 | Excellent 11.4% |