Subsaharan African vs Scandinavian Wage/Income Gap
COMPARE
Subsaharan African
Scandinavian
Wage/Income Gap
Wage/Income Gap Comparison
Sub-Saharan Africans
Scandinavians
22.8%
WAGE/INCOME GAP
99.9/ 100
METRIC RATING
72nd/ 347
METRIC RANK
29.1%
WAGE/INCOME GAP
0.0/ 100
METRIC RATING
328th/ 347
METRIC RANK
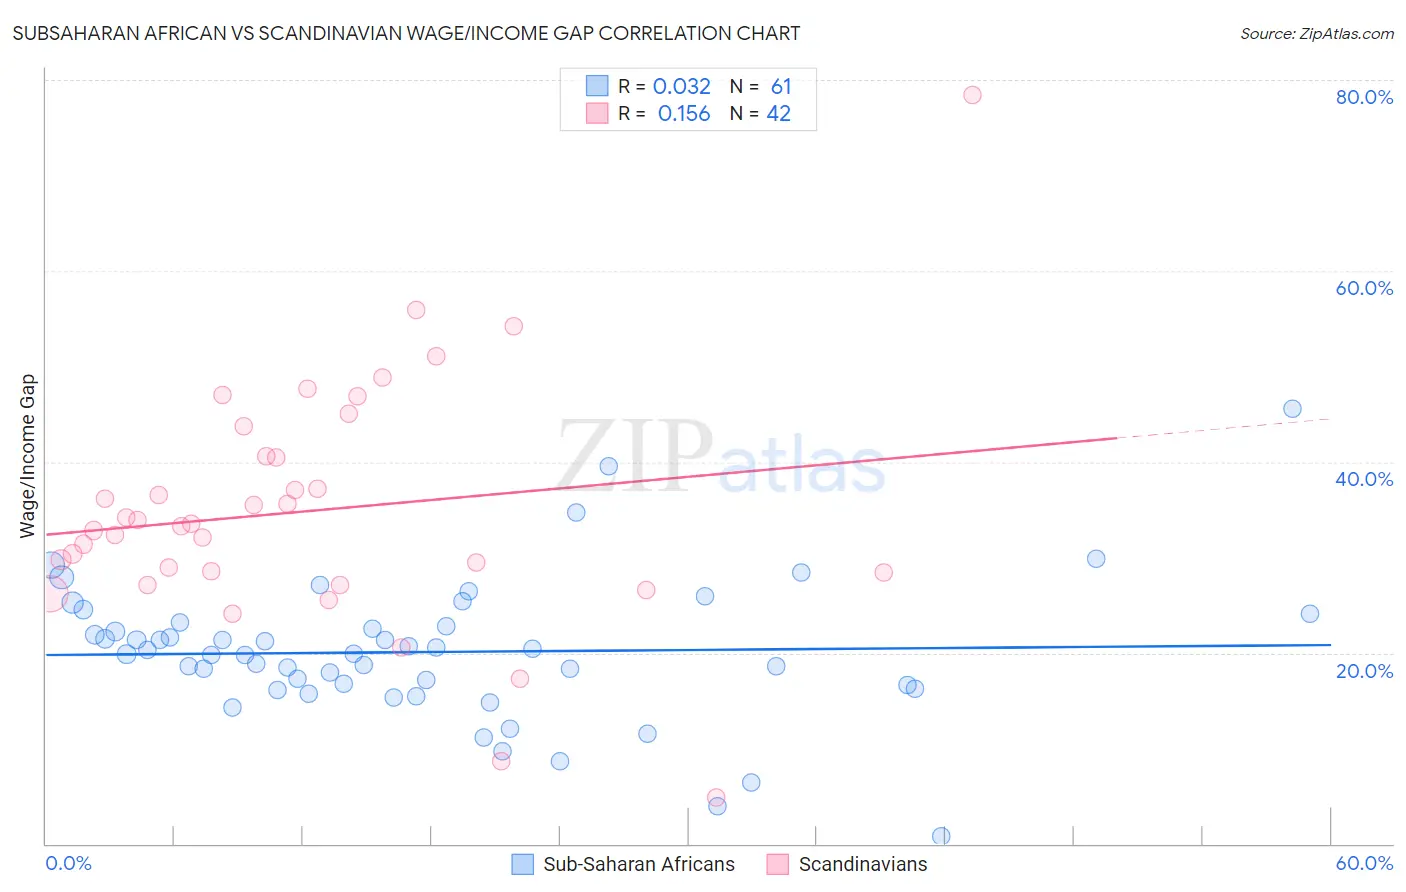
Subsaharan African vs Scandinavian Wage/Income Gap Correlation Chart
The statistical analysis conducted on geographies consisting of 507,315,173 people shows no correlation between the proportion of Sub-Saharan Africans and wage/income gap percentage in the United States with a correlation coefficient (R) of 0.032 and weighted average of 22.8%. Similarly, the statistical analysis conducted on geographies consisting of 471,744,681 people shows a poor positive correlation between the proportion of Scandinavians and wage/income gap percentage in the United States with a correlation coefficient (R) of 0.156 and weighted average of 29.1%, a difference of 27.5%.
Wage/Income Gap Correlation Summary
| Measurement | Subsaharan African | Scandinavian |
| Minimum | 0.79% | 4.8% |
| Maximum | 45.6% | 78.5% |
| Range | 44.8% | 73.7% |
| Mean | 20.1% | 34.9% |
| Median | 19.9% | 33.4% |
| Interquartile 25% (IQ1) | 16.4% | 28.4% |
| Interquartile 75% (IQ3) | 23.0% | 40.6% |
| Interquartile Range (IQR) | 6.6% | 12.2% |
| Standard Deviation (Sample) | 7.4% | 12.8% |
| Standard Deviation (Population) | 7.4% | 12.6% |
Similar Demographics by Wage/Income Gap
Demographics Similar to Sub-Saharan Africans by Wage/Income Gap
In terms of wage/income gap, the demographic groups most similar to Sub-Saharan Africans are Immigrants from Eastern Africa (22.8%, a difference of 0.030%), Immigrants from Burma/Myanmar (22.8%, a difference of 0.11%), Immigrants from El Salvador (22.8%, a difference of 0.15%), Immigrants from Uzbekistan (22.7%, a difference of 0.31%), and Fijian (22.9%, a difference of 0.39%).
| Demographics | Rating | Rank | Wage/Income Gap |
| Guatemalans | 99.9 /100 | #65 | Exceptional 22.6% |
| Central American Indians | 99.9 /100 | #66 | Exceptional 22.7% |
| Menominee | 99.9 /100 | #67 | Exceptional 22.7% |
| Immigrants | Nigeria | 99.9 /100 | #68 | Exceptional 22.7% |
| Indonesians | 99.9 /100 | #69 | Exceptional 22.7% |
| Immigrants | Uzbekistan | 99.9 /100 | #70 | Exceptional 22.7% |
| Immigrants | El Salvador | 99.9 /100 | #71 | Exceptional 22.8% |
| Sub-Saharan Africans | 99.9 /100 | #72 | Exceptional 22.8% |
| Immigrants | Eastern Africa | 99.9 /100 | #73 | Exceptional 22.8% |
| Immigrants | Burma/Myanmar | 99.9 /100 | #74 | Exceptional 22.8% |
| Fijians | 99.9 /100 | #75 | Exceptional 22.9% |
| Ecuadorians | 99.9 /100 | #76 | Exceptional 22.9% |
| Africans | 99.9 /100 | #77 | Exceptional 22.9% |
| Nigerians | 99.9 /100 | #78 | Exceptional 23.0% |
| Immigrants | Nicaragua | 99.9 /100 | #79 | Exceptional 23.0% |
Demographics Similar to Scandinavians by Wage/Income Gap
In terms of wage/income gap, the demographic groups most similar to Scandinavians are Immigrants from Iran (29.1%, a difference of 0.060%), Scottish (29.1%, a difference of 0.14%), Immigrants from Belgium (29.0%, a difference of 0.17%), Hungarian (29.0%, a difference of 0.24%), and German (29.2%, a difference of 0.24%).
| Demographics | Rating | Rank | Wage/Income Gap |
| Welsh | 0.1 /100 | #321 | Tragic 28.9% |
| Immigrants | Singapore | 0.1 /100 | #322 | Tragic 28.9% |
| Norwegians | 0.1 /100 | #323 | Tragic 29.0% |
| Croatians | 0.0 /100 | #324 | Tragic 29.0% |
| Hungarians | 0.0 /100 | #325 | Tragic 29.0% |
| Immigrants | Belgium | 0.0 /100 | #326 | Tragic 29.0% |
| Immigrants | Iran | 0.0 /100 | #327 | Tragic 29.1% |
| Scandinavians | 0.0 /100 | #328 | Tragic 29.1% |
| Scottish | 0.0 /100 | #329 | Tragic 29.1% |
| Germans | 0.0 /100 | #330 | Tragic 29.2% |
| Czechs | 0.0 /100 | #331 | Tragic 29.2% |
| Immigrants | South Central Asia | 0.0 /100 | #332 | Tragic 29.3% |
| Europeans | 0.0 /100 | #333 | Tragic 29.4% |
| Swedes | 0.0 /100 | #334 | Tragic 29.4% |
| Immigrants | Taiwan | 0.0 /100 | #335 | Tragic 29.5% |