Immigrants from Austria vs Scandinavian Wage/Income Gap
COMPARE
Immigrants from Austria
Scandinavian
Wage/Income Gap
Wage/Income Gap Comparison
Immigrants from Austria
Scandinavians
28.1%
WAGE/INCOME GAP
0.4/ 100
METRIC RATING
286th/ 347
METRIC RANK
29.1%
WAGE/INCOME GAP
0.0/ 100
METRIC RATING
328th/ 347
METRIC RANK
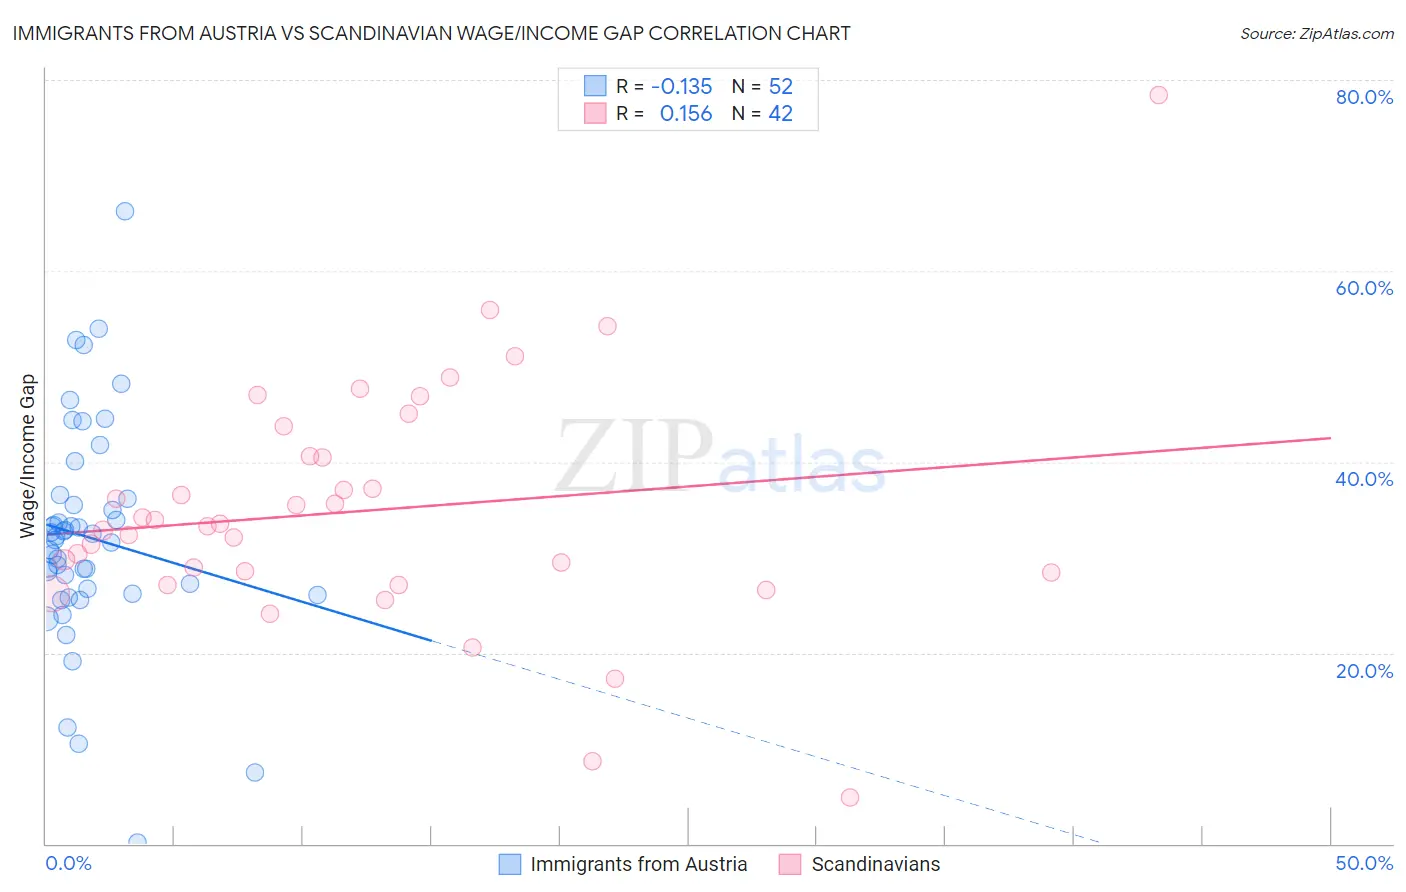
Immigrants from Austria vs Scandinavian Wage/Income Gap Correlation Chart
The statistical analysis conducted on geographies consisting of 167,902,173 people shows a poor negative correlation between the proportion of Immigrants from Austria and wage/income gap percentage in the United States with a correlation coefficient (R) of -0.135 and weighted average of 28.1%. Similarly, the statistical analysis conducted on geographies consisting of 471,744,681 people shows a poor positive correlation between the proportion of Scandinavians and wage/income gap percentage in the United States with a correlation coefficient (R) of 0.156 and weighted average of 29.1%, a difference of 3.5%.
Wage/Income Gap Correlation Summary
| Measurement | Immigrants from Austria | Scandinavian |
| Minimum | 0.18% | 4.8% |
| Maximum | 66.3% | 78.5% |
| Range | 66.1% | 73.7% |
| Mean | 32.1% | 34.9% |
| Median | 32.1% | 33.4% |
| Interquartile 25% (IQ1) | 26.4% | 28.4% |
| Interquartile 75% (IQ3) | 35.9% | 40.6% |
| Interquartile Range (IQR) | 9.4% | 12.2% |
| Standard Deviation (Sample) | 11.6% | 12.8% |
| Standard Deviation (Population) | 11.5% | 12.6% |
Similar Demographics by Wage/Income Gap
Demographics Similar to Immigrants from Austria by Wage/Income Gap
In terms of wage/income gap, the demographic groups most similar to Immigrants from Austria are Italian (28.1%, a difference of 0.030%), Okinawan (28.1%, a difference of 0.040%), Choctaw (28.1%, a difference of 0.070%), Canadian (28.1%, a difference of 0.11%), and Immigrants from Sweden (28.1%, a difference of 0.16%).
| Demographics | Rating | Rank | Wage/Income Gap |
| Romanians | 0.5 /100 | #279 | Tragic 28.0% |
| Russians | 0.5 /100 | #280 | Tragic 28.0% |
| Burmese | 0.5 /100 | #281 | Tragic 28.0% |
| South Africans | 0.5 /100 | #282 | Tragic 28.0% |
| French Canadians | 0.4 /100 | #283 | Tragic 28.1% |
| Immigrants | Sweden | 0.4 /100 | #284 | Tragic 28.1% |
| Italians | 0.4 /100 | #285 | Tragic 28.1% |
| Immigrants | Austria | 0.4 /100 | #286 | Tragic 28.1% |
| Okinawans | 0.4 /100 | #287 | Tragic 28.1% |
| Choctaw | 0.4 /100 | #288 | Tragic 28.1% |
| Canadians | 0.3 /100 | #289 | Tragic 28.1% |
| Australians | 0.3 /100 | #290 | Tragic 28.2% |
| Czechoslovakians | 0.3 /100 | #291 | Tragic 28.2% |
| Immigrants | Australia | 0.3 /100 | #292 | Tragic 28.2% |
| Immigrants | Israel | 0.3 /100 | #293 | Tragic 28.2% |
Demographics Similar to Scandinavians by Wage/Income Gap
In terms of wage/income gap, the demographic groups most similar to Scandinavians are Immigrants from Iran (29.1%, a difference of 0.060%), Scottish (29.1%, a difference of 0.14%), Immigrants from Belgium (29.0%, a difference of 0.17%), Hungarian (29.0%, a difference of 0.24%), and German (29.2%, a difference of 0.24%).
| Demographics | Rating | Rank | Wage/Income Gap |
| Welsh | 0.1 /100 | #321 | Tragic 28.9% |
| Immigrants | Singapore | 0.1 /100 | #322 | Tragic 28.9% |
| Norwegians | 0.1 /100 | #323 | Tragic 29.0% |
| Croatians | 0.0 /100 | #324 | Tragic 29.0% |
| Hungarians | 0.0 /100 | #325 | Tragic 29.0% |
| Immigrants | Belgium | 0.0 /100 | #326 | Tragic 29.0% |
| Immigrants | Iran | 0.0 /100 | #327 | Tragic 29.1% |
| Scandinavians | 0.0 /100 | #328 | Tragic 29.1% |
| Scottish | 0.0 /100 | #329 | Tragic 29.1% |
| Germans | 0.0 /100 | #330 | Tragic 29.2% |
| Czechs | 0.0 /100 | #331 | Tragic 29.2% |
| Immigrants | South Central Asia | 0.0 /100 | #332 | Tragic 29.3% |
| Europeans | 0.0 /100 | #333 | Tragic 29.4% |
| Swedes | 0.0 /100 | #334 | Tragic 29.4% |
| Immigrants | Taiwan | 0.0 /100 | #335 | Tragic 29.5% |