Subsaharan African vs Immigrants from Chile Householder Income Over 65 years
COMPARE
Subsaharan African
Immigrants from Chile
Householder Income Over 65 years
Householder Income Over 65 years Comparison
Sub-Saharan Africans
Immigrants from Chile
$56,615
HOUSEHOLDER INCOME OVER 65 YEARS
1.0/ 100
METRIC RATING
240th/ 347
METRIC RANK
$62,354
HOUSEHOLDER INCOME OVER 65 YEARS
81.0/ 100
METRIC RATING
135th/ 347
METRIC RANK
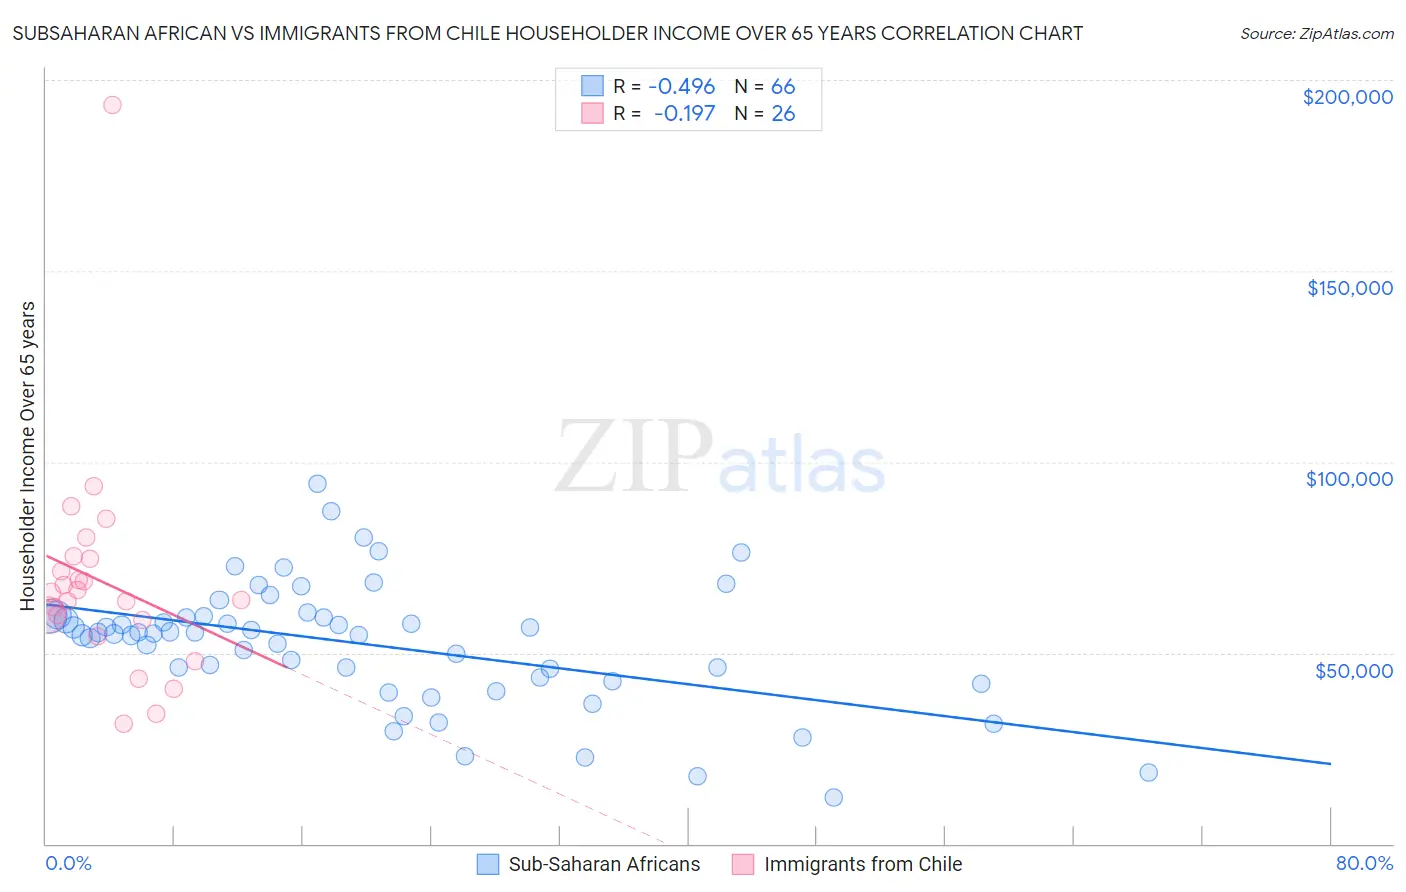
Subsaharan African vs Immigrants from Chile Householder Income Over 65 years Correlation Chart
The statistical analysis conducted on geographies consisting of 505,008,485 people shows a moderate negative correlation between the proportion of Sub-Saharan Africans and household income with householder over the age of 65 in the United States with a correlation coefficient (R) of -0.496 and weighted average of $56,615. Similarly, the statistical analysis conducted on geographies consisting of 218,471,340 people shows a poor negative correlation between the proportion of Immigrants from Chile and household income with householder over the age of 65 in the United States with a correlation coefficient (R) of -0.197 and weighted average of $62,354, a difference of 10.1%.
Householder Income Over 65 years Correlation Summary
| Measurement | Subsaharan African | Immigrants from Chile |
| Minimum | $12,049 | $31,406 |
| Maximum | $94,427 | $193,611 |
| Range | $82,378 | $162,205 |
| Mean | $52,341 | $68,575 |
| Median | $55,146 | $64,728 |
| Interquartile 25% (IQ1) | $43,507 | $58,558 |
| Interquartile 75% (IQ3) | $59,521 | $74,792 |
| Interquartile Range (IQR) | $16,014 | $16,234 |
| Standard Deviation (Sample) | $16,149 | $29,777 |
| Standard Deviation (Population) | $16,026 | $29,198 |
Similar Demographics by Householder Income Over 65 years
Demographics Similar to Sub-Saharan Africans by Householder Income Over 65 years
In terms of householder income over 65 years, the demographic groups most similar to Sub-Saharan Africans are Immigrants from Laos ($56,722, a difference of 0.19%), Immigrants from Guyana ($56,495, a difference of 0.21%), Fijian ($56,768, a difference of 0.27%), Yaqui ($56,417, a difference of 0.35%), and Guyanese ($56,351, a difference of 0.47%).
| Demographics | Rating | Rank | Householder Income Over 65 years |
| Immigrants | Western Africa | 1.7 /100 | #233 | Tragic $57,119 |
| Immigrants | Burma/Myanmar | 1.7 /100 | #234 | Tragic $57,114 |
| Spanish Americans | 1.6 /100 | #235 | Tragic $57,021 |
| Immigrants | Uruguay | 1.5 /100 | #236 | Tragic $56,975 |
| Immigrants | Panama | 1.5 /100 | #237 | Tragic $56,944 |
| Fijians | 1.2 /100 | #238 | Tragic $56,768 |
| Immigrants | Laos | 1.2 /100 | #239 | Tragic $56,722 |
| Sub-Saharan Africans | 1.0 /100 | #240 | Tragic $56,615 |
| Immigrants | Guyana | 0.9 /100 | #241 | Tragic $56,495 |
| Yaqui | 0.8 /100 | #242 | Tragic $56,417 |
| Guyanese | 0.8 /100 | #243 | Tragic $56,351 |
| Hmong | 0.8 /100 | #244 | Tragic $56,339 |
| Immigrants | Uzbekistan | 0.8 /100 | #245 | Tragic $56,331 |
| Central Americans | 0.8 /100 | #246 | Tragic $56,321 |
| Yakama | 0.7 /100 | #247 | Tragic $56,234 |
Demographics Similar to Immigrants from Chile by Householder Income Over 65 years
In terms of householder income over 65 years, the demographic groups most similar to Immigrants from Chile are Immigrants from Brazil ($62,364, a difference of 0.020%), Alaskan Athabascan ($62,330, a difference of 0.040%), Immigrants from Syria ($62,303, a difference of 0.080%), Immigrants from Kazakhstan ($62,292, a difference of 0.10%), and Lebanese ($62,287, a difference of 0.11%).
| Demographics | Rating | Rank | Householder Income Over 65 years |
| Aleuts | 86.1 /100 | #128 | Excellent $62,708 |
| Immigrants | Eastern Europe | 85.9 /100 | #129 | Excellent $62,693 |
| Basques | 85.4 /100 | #130 | Excellent $62,653 |
| Immigrants | Western Asia | 85.3 /100 | #131 | Excellent $62,645 |
| Immigrants | Germany | 83.9 /100 | #132 | Excellent $62,544 |
| Immigrants | Northern Africa | 83.6 /100 | #133 | Excellent $62,522 |
| Immigrants | Brazil | 81.2 /100 | #134 | Excellent $62,364 |
| Immigrants | Chile | 81.0 /100 | #135 | Excellent $62,354 |
| Alaskan Athabascans | 80.6 /100 | #136 | Excellent $62,330 |
| Immigrants | Syria | 80.2 /100 | #137 | Excellent $62,303 |
| Immigrants | Kazakhstan | 80.0 /100 | #138 | Excellent $62,292 |
| Lebanese | 79.9 /100 | #139 | Good $62,287 |
| Arabs | 79.6 /100 | #140 | Good $62,266 |
| Canadians | 79.0 /100 | #141 | Good $62,230 |
| South American Indians | 78.7 /100 | #142 | Good $62,215 |