Subsaharan African vs Alsatian Householder Income Over 65 years
COMPARE
Subsaharan African
Alsatian
Householder Income Over 65 years
Householder Income Over 65 years Comparison
Sub-Saharan Africans
Alsatians
$56,615
HOUSEHOLDER INCOME OVER 65 YEARS
1.0/ 100
METRIC RATING
240th/ 347
METRIC RANK
$61,797
HOUSEHOLDER INCOME OVER 65 YEARS
70.5/ 100
METRIC RATING
148th/ 347
METRIC RANK
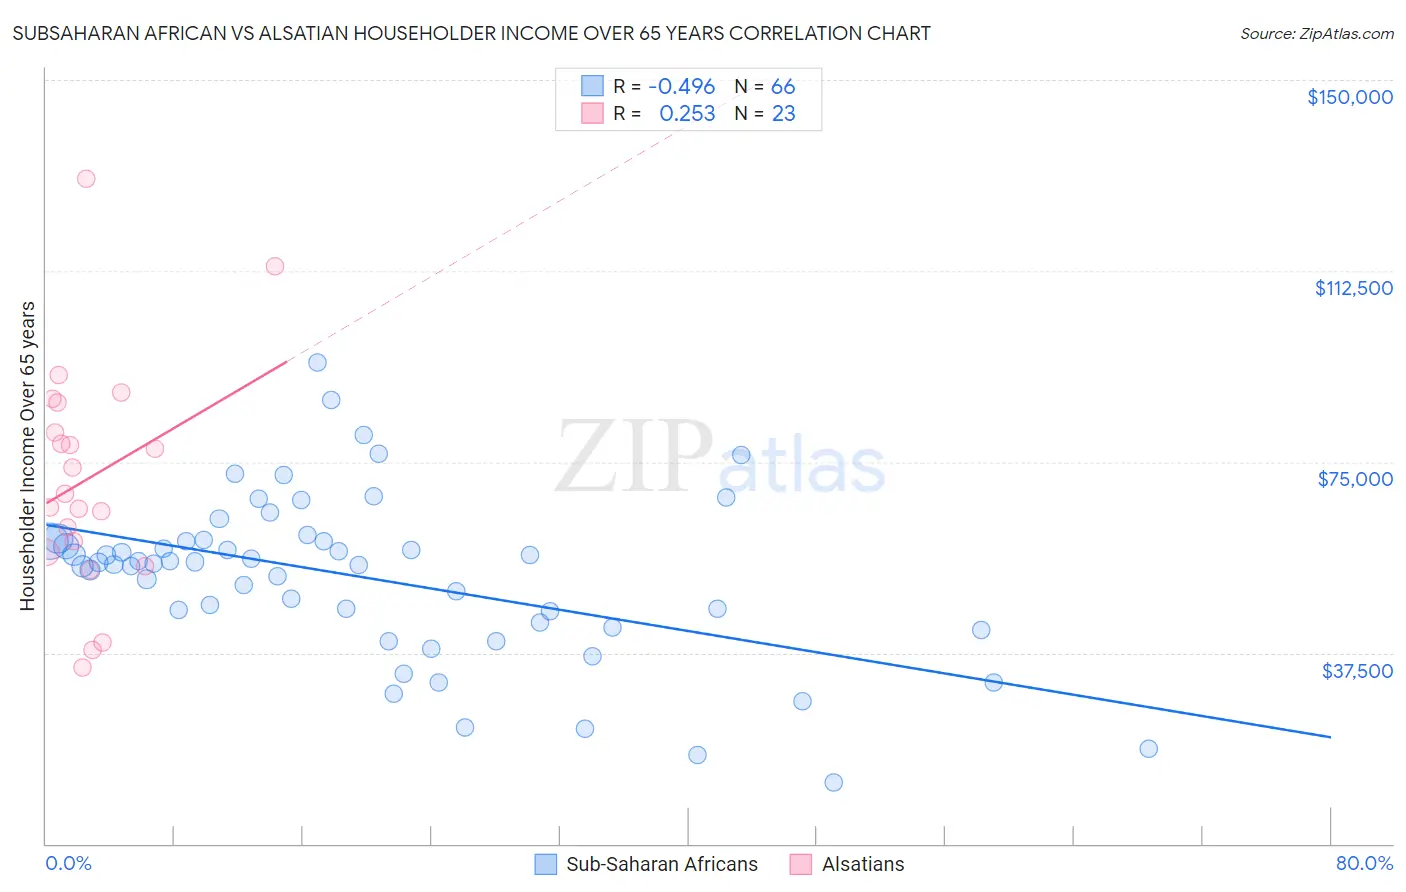
Subsaharan African vs Alsatian Householder Income Over 65 years Correlation Chart
The statistical analysis conducted on geographies consisting of 505,008,485 people shows a moderate negative correlation between the proportion of Sub-Saharan Africans and household income with householder over the age of 65 in the United States with a correlation coefficient (R) of -0.496 and weighted average of $56,615. Similarly, the statistical analysis conducted on geographies consisting of 82,660,993 people shows a weak positive correlation between the proportion of Alsatians and household income with householder over the age of 65 in the United States with a correlation coefficient (R) of 0.253 and weighted average of $61,797, a difference of 9.1%.
Householder Income Over 65 years Correlation Summary
| Measurement | Subsaharan African | Alsatian |
| Minimum | $12,049 | $34,700 |
| Maximum | $94,427 | $130,500 |
| Range | $82,378 | $95,800 |
| Mean | $52,341 | $71,864 |
| Median | $55,146 | $68,750 |
| Interquartile 25% (IQ1) | $43,507 | $57,175 |
| Interquartile 75% (IQ3) | $59,521 | $86,740 |
| Interquartile Range (IQR) | $16,014 | $29,565 |
| Standard Deviation (Sample) | $16,149 | $22,665 |
| Standard Deviation (Population) | $16,026 | $22,167 |
Similar Demographics by Householder Income Over 65 years
Demographics Similar to Sub-Saharan Africans by Householder Income Over 65 years
In terms of householder income over 65 years, the demographic groups most similar to Sub-Saharan Africans are Immigrants from Laos ($56,722, a difference of 0.19%), Immigrants from Guyana ($56,495, a difference of 0.21%), Fijian ($56,768, a difference of 0.27%), Yaqui ($56,417, a difference of 0.35%), and Guyanese ($56,351, a difference of 0.47%).
| Demographics | Rating | Rank | Householder Income Over 65 years |
| Immigrants | Western Africa | 1.7 /100 | #233 | Tragic $57,119 |
| Immigrants | Burma/Myanmar | 1.7 /100 | #234 | Tragic $57,114 |
| Spanish Americans | 1.6 /100 | #235 | Tragic $57,021 |
| Immigrants | Uruguay | 1.5 /100 | #236 | Tragic $56,975 |
| Immigrants | Panama | 1.5 /100 | #237 | Tragic $56,944 |
| Fijians | 1.2 /100 | #238 | Tragic $56,768 |
| Immigrants | Laos | 1.2 /100 | #239 | Tragic $56,722 |
| Sub-Saharan Africans | 1.0 /100 | #240 | Tragic $56,615 |
| Immigrants | Guyana | 0.9 /100 | #241 | Tragic $56,495 |
| Yaqui | 0.8 /100 | #242 | Tragic $56,417 |
| Guyanese | 0.8 /100 | #243 | Tragic $56,351 |
| Hmong | 0.8 /100 | #244 | Tragic $56,339 |
| Immigrants | Uzbekistan | 0.8 /100 | #245 | Tragic $56,331 |
| Central Americans | 0.8 /100 | #246 | Tragic $56,321 |
| Yakama | 0.7 /100 | #247 | Tragic $56,234 |
Demographics Similar to Alsatians by Householder Income Over 65 years
In terms of householder income over 65 years, the demographic groups most similar to Alsatians are Immigrants from Nepal ($61,843, a difference of 0.070%), Scottish ($61,735, a difference of 0.10%), Slavic ($61,709, a difference of 0.14%), Immigrants from Southern Europe ($61,902, a difference of 0.17%), and Hungarian ($61,673, a difference of 0.20%).
| Demographics | Rating | Rank | Householder Income Over 65 years |
| Canadians | 79.0 /100 | #141 | Good $62,230 |
| South American Indians | 78.7 /100 | #142 | Good $62,215 |
| Immigrants | Belarus | 77.8 /100 | #143 | Good $62,162 |
| Immigrants | Peru | 74.4 /100 | #144 | Good $61,988 |
| Immigrants | Uganda | 74.2 /100 | #145 | Good $61,976 |
| Immigrants | Southern Europe | 72.7 /100 | #146 | Good $61,902 |
| Immigrants | Nepal | 71.4 /100 | #147 | Good $61,843 |
| Alsatians | 70.5 /100 | #148 | Good $61,797 |
| Scottish | 69.1 /100 | #149 | Good $61,735 |
| Slavs | 68.5 /100 | #150 | Good $61,709 |
| Hungarians | 67.7 /100 | #151 | Good $61,673 |
| Armenians | 67.3 /100 | #152 | Good $61,656 |
| Costa Ricans | 66.9 /100 | #153 | Good $61,638 |
| Swiss | 66.5 /100 | #154 | Good $61,621 |
| Poles | 65.9 /100 | #155 | Good $61,598 |