Subsaharan African vs Immigrants from Chile 3rd Grade
COMPARE
Subsaharan African
Immigrants from Chile
3rd Grade
3rd Grade Comparison
Sub-Saharan Africans
Immigrants from Chile
97.5%
3RD GRADE
3.2/ 100
METRIC RATING
228th/ 347
METRIC RANK
97.6%
3RD GRADE
16.5/ 100
METRIC RATING
204th/ 347
METRIC RANK
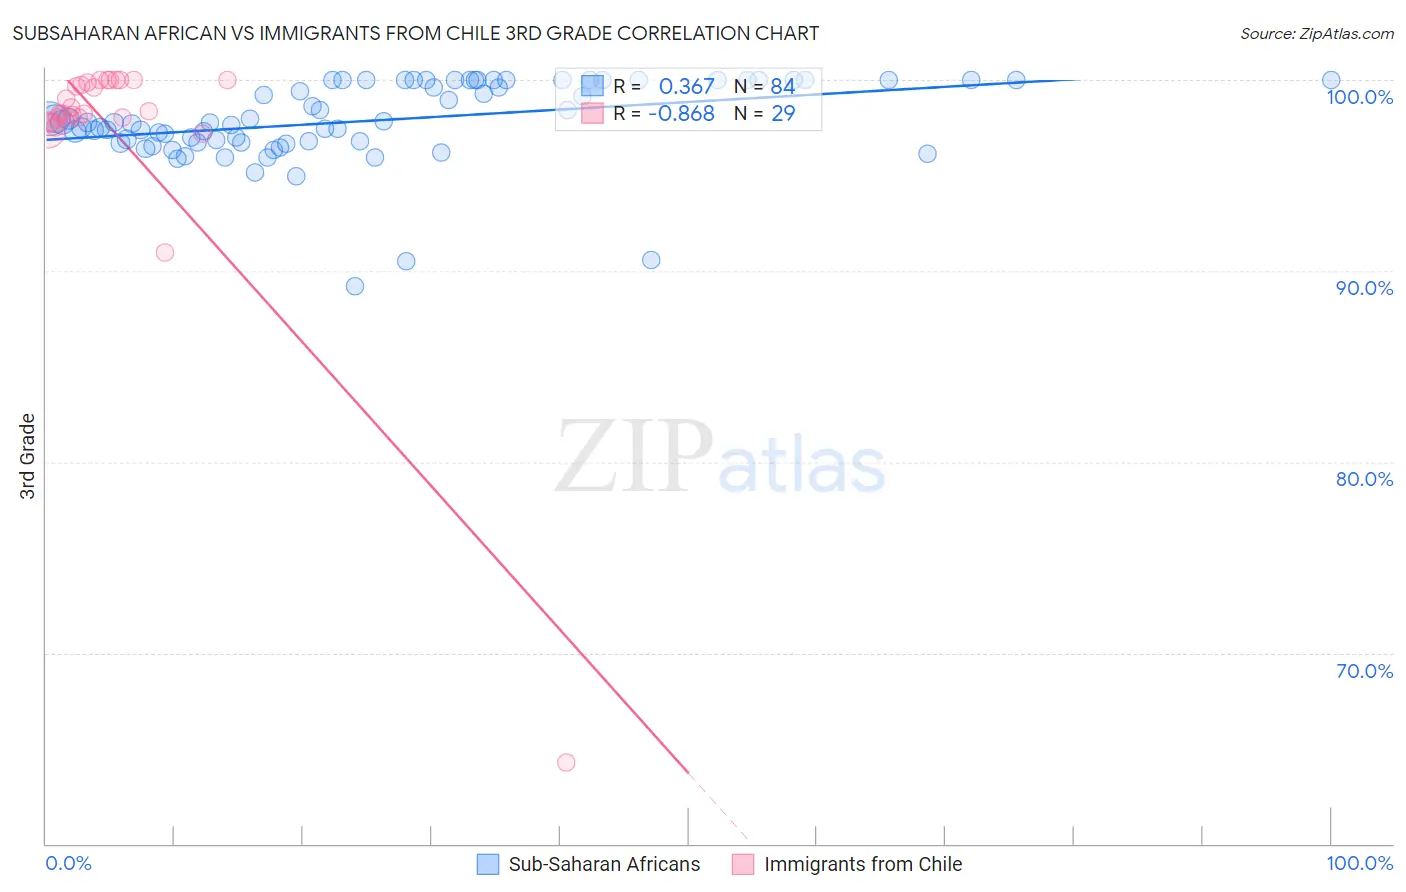
Subsaharan African vs Immigrants from Chile 3rd Grade Correlation Chart
The statistical analysis conducted on geographies consisting of 508,209,936 people shows a mild positive correlation between the proportion of Sub-Saharan Africans and percentage of population with at least 3rd grade education in the United States with a correlation coefficient (R) of 0.367 and weighted average of 97.5%. Similarly, the statistical analysis conducted on geographies consisting of 218,647,266 people shows a very strong negative correlation between the proportion of Immigrants from Chile and percentage of population with at least 3rd grade education in the United States with a correlation coefficient (R) of -0.868 and weighted average of 97.6%, a difference of 0.15%.
3rd Grade Correlation Summary
| Measurement | Subsaharan African | Immigrants from Chile |
| Minimum | 89.2% | 64.3% |
| Maximum | 100.0% | 100.0% |
| Range | 10.8% | 35.7% |
| Mean | 97.9% | 97.3% |
| Median | 97.8% | 98.2% |
| Interquartile 25% (IQ1) | 96.8% | 97.9% |
| Interquartile 75% (IQ3) | 100.0% | 99.9% |
| Interquartile Range (IQR) | 3.2% | 2.0% |
| Standard Deviation (Sample) | 2.1% | 6.6% |
| Standard Deviation (Population) | 2.1% | 6.5% |
Similar Demographics by 3rd Grade
Demographics Similar to Sub-Saharan Africans by 3rd Grade
In terms of 3rd grade, the demographic groups most similar to Sub-Saharan Africans are Immigrants from Sudan (97.5%, a difference of 0.010%), Senegalese (97.5%, a difference of 0.010%), Immigrants from Pakistan (97.5%, a difference of 0.010%), Immigrants from Costa Rica (97.5%, a difference of 0.010%), and Sudanese (97.5%, a difference of 0.020%).
| Demographics | Rating | Rank | 3rd Grade |
| Uruguayans | 5.0 /100 | #221 | Tragic 97.5% |
| Sierra Leoneans | 4.6 /100 | #222 | Tragic 97.5% |
| Immigrants | Syria | 4.4 /100 | #223 | Tragic 97.5% |
| Bahamians | 4.4 /100 | #224 | Tragic 97.5% |
| Tongans | 4.3 /100 | #225 | Tragic 97.5% |
| Sudanese | 4.1 /100 | #226 | Tragic 97.5% |
| Immigrants | Sudan | 3.4 /100 | #227 | Tragic 97.5% |
| Sub-Saharan Africans | 3.2 /100 | #228 | Tragic 97.5% |
| Senegalese | 3.0 /100 | #229 | Tragic 97.5% |
| Immigrants | Pakistan | 2.7 /100 | #230 | Tragic 97.5% |
| Immigrants | Costa Rica | 2.7 /100 | #231 | Tragic 97.5% |
| Immigrants | Western Asia | 2.6 /100 | #232 | Tragic 97.5% |
| Immigrants | Malaysia | 2.4 /100 | #233 | Tragic 97.5% |
| Immigrants | Eastern Asia | 1.9 /100 | #234 | Tragic 97.4% |
| Immigrants | Iraq | 1.8 /100 | #235 | Tragic 97.4% |
Demographics Similar to Immigrants from Chile by 3rd Grade
In terms of 3rd grade, the demographic groups most similar to Immigrants from Chile are Paiute (97.6%, a difference of 0.0%), Immigrants from Southern Europe (97.6%, a difference of 0.010%), African (97.6%, a difference of 0.010%), Immigrants from Northern Africa (97.6%, a difference of 0.020%), and Immigrants from Ukraine (97.7%, a difference of 0.030%).
| Demographics | Rating | Rank | 3rd Grade |
| Hawaiians | 25.7 /100 | #197 | Fair 97.7% |
| Guamanians/Chamorros | 23.6 /100 | #198 | Fair 97.7% |
| Immigrants | Ukraine | 22.7 /100 | #199 | Fair 97.7% |
| Immigrants | Albania | 22.6 /100 | #200 | Fair 97.7% |
| Immigrants | Lebanon | 21.7 /100 | #201 | Fair 97.7% |
| Immigrants | Southern Europe | 17.7 /100 | #202 | Poor 97.6% |
| Paiute | 16.7 /100 | #203 | Poor 97.6% |
| Immigrants | Chile | 16.5 /100 | #204 | Poor 97.6% |
| Africans | 14.5 /100 | #205 | Poor 97.6% |
| Immigrants | Northern Africa | 13.0 /100 | #206 | Poor 97.6% |
| Tohono O'odham | 12.5 /100 | #207 | Poor 97.6% |
| Immigrants | Zaire | 11.9 /100 | #208 | Poor 97.6% |
| Costa Ricans | 9.6 /100 | #209 | Tragic 97.6% |
| Immigrants | Oceania | 9.5 /100 | #210 | Tragic 97.6% |
| Laotians | 9.4 /100 | #211 | Tragic 97.6% |