Mexican American Indian vs Immigrants from Chile Householder Income Over 65 years
COMPARE
Mexican American Indian
Immigrants from Chile
Householder Income Over 65 years
Householder Income Over 65 years Comparison
Mexican American Indians
Immigrants from Chile
$56,089
HOUSEHOLDER INCOME OVER 65 YEARS
0.6/ 100
METRIC RATING
249th/ 347
METRIC RANK
$62,354
HOUSEHOLDER INCOME OVER 65 YEARS
81.0/ 100
METRIC RATING
135th/ 347
METRIC RANK
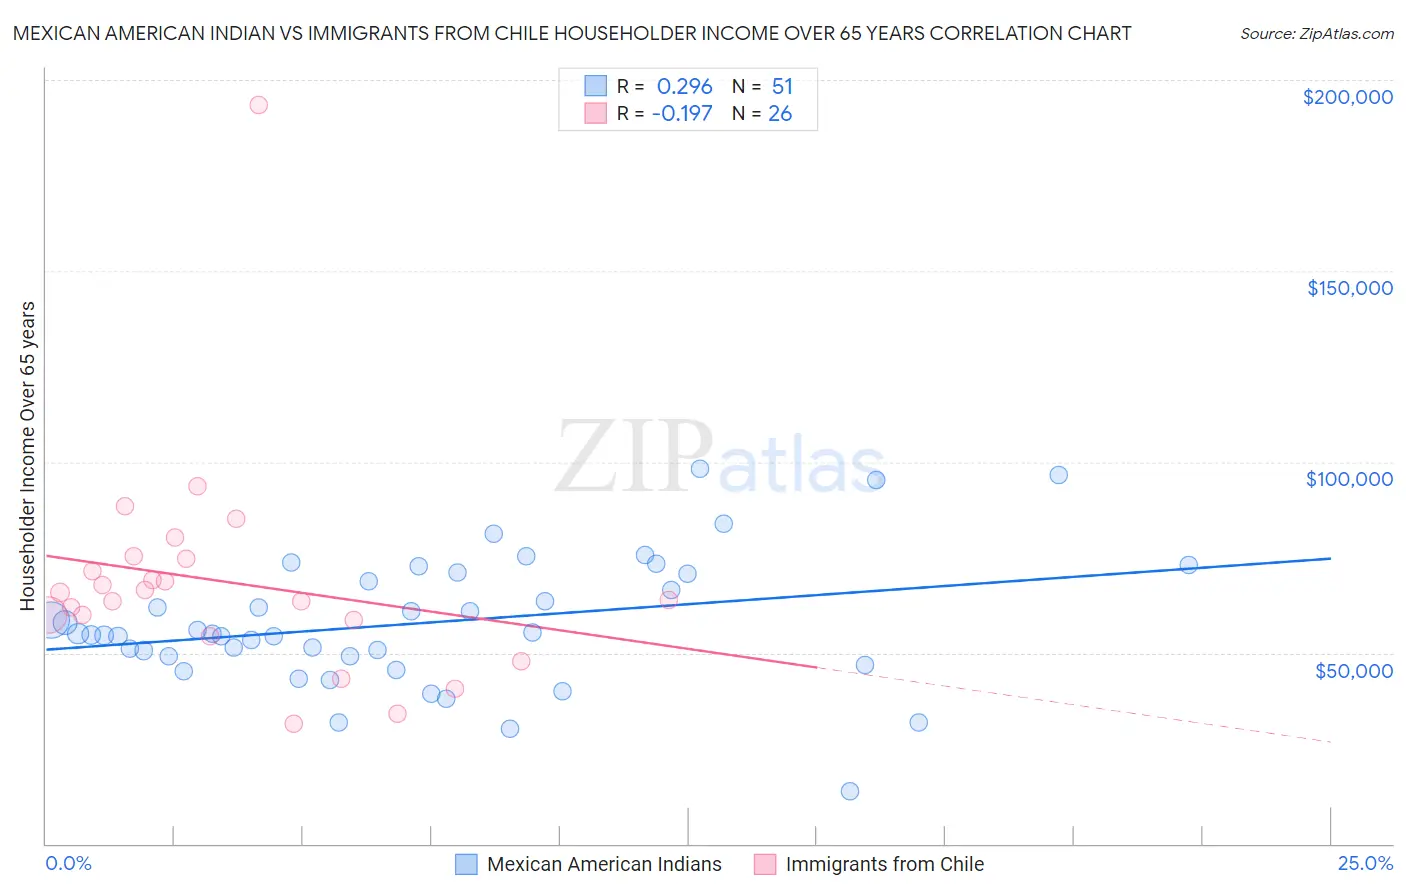
Mexican American Indian vs Immigrants from Chile Householder Income Over 65 years Correlation Chart
The statistical analysis conducted on geographies consisting of 316,694,324 people shows a weak positive correlation between the proportion of Mexican American Indians and household income with householder over the age of 65 in the United States with a correlation coefficient (R) of 0.296 and weighted average of $56,089. Similarly, the statistical analysis conducted on geographies consisting of 218,471,340 people shows a poor negative correlation between the proportion of Immigrants from Chile and household income with householder over the age of 65 in the United States with a correlation coefficient (R) of -0.197 and weighted average of $62,354, a difference of 11.2%.
Householder Income Over 65 years Correlation Summary
| Measurement | Mexican American Indian | Immigrants from Chile |
| Minimum | $13,750 | $31,406 |
| Maximum | $98,333 | $193,611 |
| Range | $84,583 | $162,205 |
| Mean | $57,833 | $68,575 |
| Median | $54,877 | $64,728 |
| Interquartile 25% (IQ1) | $48,998 | $58,558 |
| Interquartile 75% (IQ3) | $70,643 | $74,792 |
| Interquartile Range (IQR) | $21,645 | $16,234 |
| Standard Deviation (Sample) | $16,994 | $29,777 |
| Standard Deviation (Population) | $16,827 | $29,198 |
Similar Demographics by Householder Income Over 65 years
Demographics Similar to Mexican American Indians by Householder Income Over 65 years
In terms of householder income over 65 years, the demographic groups most similar to Mexican American Indians are Vietnamese ($56,143, a difference of 0.10%), Immigrants from Bosnia and Herzegovina ($55,986, a difference of 0.19%), Yakama ($56,234, a difference of 0.26%), Immigrants from Portugal ($55,924, a difference of 0.30%), and Central American ($56,321, a difference of 0.41%).
| Demographics | Rating | Rank | Householder Income Over 65 years |
| Yaqui | 0.8 /100 | #242 | Tragic $56,417 |
| Guyanese | 0.8 /100 | #243 | Tragic $56,351 |
| Hmong | 0.8 /100 | #244 | Tragic $56,339 |
| Immigrants | Uzbekistan | 0.8 /100 | #245 | Tragic $56,331 |
| Central Americans | 0.8 /100 | #246 | Tragic $56,321 |
| Yakama | 0.7 /100 | #247 | Tragic $56,234 |
| Vietnamese | 0.6 /100 | #248 | Tragic $56,143 |
| Mexican American Indians | 0.6 /100 | #249 | Tragic $56,089 |
| Immigrants | Bosnia and Herzegovina | 0.5 /100 | #250 | Tragic $55,986 |
| Immigrants | Portugal | 0.5 /100 | #251 | Tragic $55,924 |
| Osage | 0.4 /100 | #252 | Tragic $55,677 |
| Immigrants | Trinidad and Tobago | 0.4 /100 | #253 | Tragic $55,598 |
| Americans | 0.3 /100 | #254 | Tragic $55,527 |
| Immigrants | Bangladesh | 0.3 /100 | #255 | Tragic $55,394 |
| German Russians | 0.3 /100 | #256 | Tragic $55,356 |
Demographics Similar to Immigrants from Chile by Householder Income Over 65 years
In terms of householder income over 65 years, the demographic groups most similar to Immigrants from Chile are Immigrants from Brazil ($62,364, a difference of 0.020%), Alaskan Athabascan ($62,330, a difference of 0.040%), Immigrants from Syria ($62,303, a difference of 0.080%), Immigrants from Kazakhstan ($62,292, a difference of 0.10%), and Lebanese ($62,287, a difference of 0.11%).
| Demographics | Rating | Rank | Householder Income Over 65 years |
| Aleuts | 86.1 /100 | #128 | Excellent $62,708 |
| Immigrants | Eastern Europe | 85.9 /100 | #129 | Excellent $62,693 |
| Basques | 85.4 /100 | #130 | Excellent $62,653 |
| Immigrants | Western Asia | 85.3 /100 | #131 | Excellent $62,645 |
| Immigrants | Germany | 83.9 /100 | #132 | Excellent $62,544 |
| Immigrants | Northern Africa | 83.6 /100 | #133 | Excellent $62,522 |
| Immigrants | Brazil | 81.2 /100 | #134 | Excellent $62,364 |
| Immigrants | Chile | 81.0 /100 | #135 | Excellent $62,354 |
| Alaskan Athabascans | 80.6 /100 | #136 | Excellent $62,330 |
| Immigrants | Syria | 80.2 /100 | #137 | Excellent $62,303 |
| Immigrants | Kazakhstan | 80.0 /100 | #138 | Excellent $62,292 |
| Lebanese | 79.9 /100 | #139 | Good $62,287 |
| Arabs | 79.6 /100 | #140 | Good $62,266 |
| Canadians | 79.0 /100 | #141 | Good $62,230 |
| South American Indians | 78.7 /100 | #142 | Good $62,215 |