Subsaharan African vs Hmong 2nd Grade
COMPARE
Subsaharan African
Hmong
2nd Grade
2nd Grade Comparison
Sub-Saharan Africans
Hmong
97.6%
2ND GRADE
3.4/ 100
METRIC RATING
228th/ 347
METRIC RANK
98.0%
2ND GRADE
80.0/ 100
METRIC RATING
144th/ 347
METRIC RANK
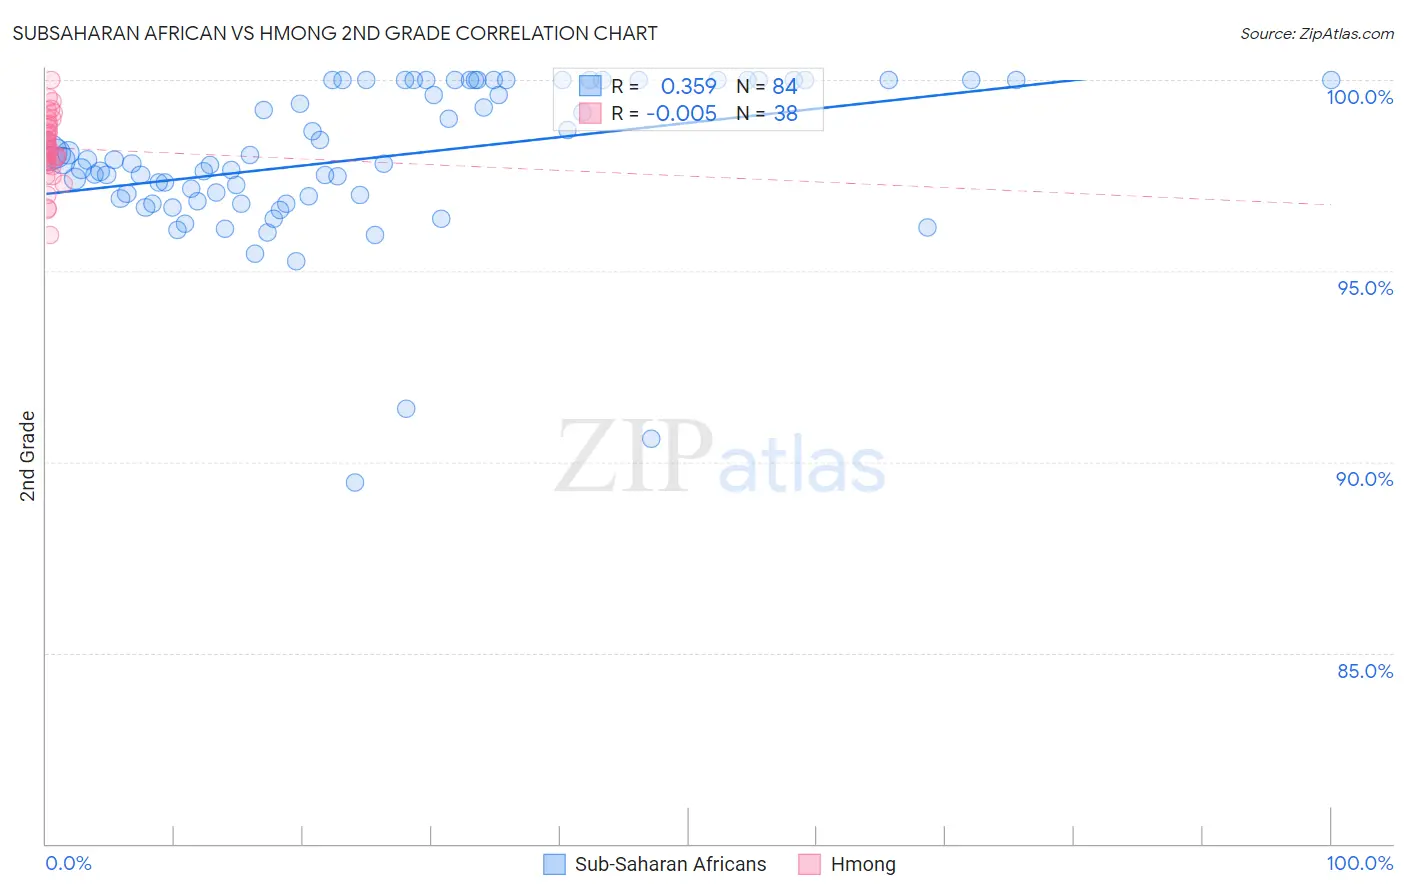
Subsaharan African vs Hmong 2nd Grade Correlation Chart
The statistical analysis conducted on geographies consisting of 508,209,936 people shows a mild positive correlation between the proportion of Sub-Saharan Africans and percentage of population with at least 2nd grade education in the United States with a correlation coefficient (R) of 0.359 and weighted average of 97.6%. Similarly, the statistical analysis conducted on geographies consisting of 24,672,093 people shows no correlation between the proportion of Hmong and percentage of population with at least 2nd grade education in the United States with a correlation coefficient (R) of -0.005 and weighted average of 98.0%, a difference of 0.37%.
2nd Grade Correlation Summary
| Measurement | Subsaharan African | Hmong |
| Minimum | 89.5% | 95.9% |
| Maximum | 100.0% | 100.0% |
| Range | 10.5% | 4.1% |
| Mean | 98.0% | 98.2% |
| Median | 97.9% | 98.2% |
| Interquartile 25% (IQ1) | 96.9% | 97.8% |
| Interquartile 75% (IQ3) | 100.0% | 98.8% |
| Interquartile Range (IQR) | 3.1% | 0.98% |
| Standard Deviation (Sample) | 2.0% | 0.85% |
| Standard Deviation (Population) | 2.0% | 0.84% |
Similar Demographics by 2nd Grade
Demographics Similar to Sub-Saharan Africans by 2nd Grade
In terms of 2nd grade, the demographic groups most similar to Sub-Saharan Africans are Immigrants from Syria (97.6%, a difference of 0.010%), Immigrants from Nepal (97.6%, a difference of 0.010%), Immigrants from Costa Rica (97.6%, a difference of 0.010%), Senegalese (97.6%, a difference of 0.010%), and Iraqi (97.6%, a difference of 0.020%).
| Demographics | Rating | Rank | 2nd Grade |
| Iraqis | 4.6 /100 | #221 | Tragic 97.6% |
| Immigrants | Sudan | 4.5 /100 | #222 | Tragic 97.6% |
| Sierra Leoneans | 4.3 /100 | #223 | Tragic 97.6% |
| Immigrants | Zaire | 4.3 /100 | #224 | Tragic 97.6% |
| Tongans | 4.3 /100 | #225 | Tragic 97.6% |
| Immigrants | Syria | 4.0 /100 | #226 | Tragic 97.6% |
| Immigrants | Nepal | 4.0 /100 | #227 | Tragic 97.6% |
| Sub-Saharan Africans | 3.4 /100 | #228 | Tragic 97.6% |
| Immigrants | Costa Rica | 3.1 /100 | #229 | Tragic 97.6% |
| Senegalese | 3.1 /100 | #230 | Tragic 97.6% |
| Immigrants | Pakistan | 2.3 /100 | #231 | Tragic 97.6% |
| Immigrants | Western Asia | 2.1 /100 | #232 | Tragic 97.6% |
| Immigrants | Uruguay | 2.1 /100 | #233 | Tragic 97.6% |
| Immigrants | Malaysia | 2.0 /100 | #234 | Tragic 97.6% |
| Colombians | 1.9 /100 | #235 | Tragic 97.6% |
Demographics Similar to Hmong by 2nd Grade
In terms of 2nd grade, the demographic groups most similar to Hmong are Alsatian (98.0%, a difference of 0.0%), Filipino (98.0%, a difference of 0.0%), Burmese (98.0%, a difference of 0.010%), Immigrants from Israel (98.0%, a difference of 0.010%), and Immigrants from Greece (98.0%, a difference of 0.010%).
| Demographics | Rating | Rank | 2nd Grade |
| Immigrants | Romania | 88.3 /100 | #137 | Excellent 98.0% |
| Israelis | 87.9 /100 | #138 | Excellent 98.0% |
| Blackfeet | 87.5 /100 | #139 | Excellent 98.0% |
| Palestinians | 83.9 /100 | #140 | Excellent 98.0% |
| Immigrants | Turkey | 83.0 /100 | #141 | Excellent 98.0% |
| Burmese | 81.0 /100 | #142 | Excellent 98.0% |
| Alsatians | 80.5 /100 | #143 | Excellent 98.0% |
| Hmong | 80.0 /100 | #144 | Good 98.0% |
| Filipinos | 79.2 /100 | #145 | Good 98.0% |
| Immigrants | Israel | 78.0 /100 | #146 | Good 98.0% |
| Immigrants | Greece | 76.8 /100 | #147 | Good 98.0% |
| Jordanians | 74.5 /100 | #148 | Good 98.0% |
| Apache | 74.0 /100 | #149 | Good 97.9% |
| Immigrants | Moldova | 72.9 /100 | #150 | Good 97.9% |
| Soviet Union | 70.7 /100 | #151 | Good 97.9% |