Subsaharan African vs Immigrants from Lebanon Median Female Earnings
COMPARE
Subsaharan African
Immigrants from Lebanon
Median Female Earnings
Median Female Earnings Comparison
Sub-Saharan Africans
Immigrants from Lebanon
$38,391
MEDIAN FEMALE EARNINGS
6.2/ 100
METRIC RATING
228th/ 347
METRIC RANK
$41,183
MEDIAN FEMALE EARNINGS
95.6/ 100
METRIC RATING
118th/ 347
METRIC RANK
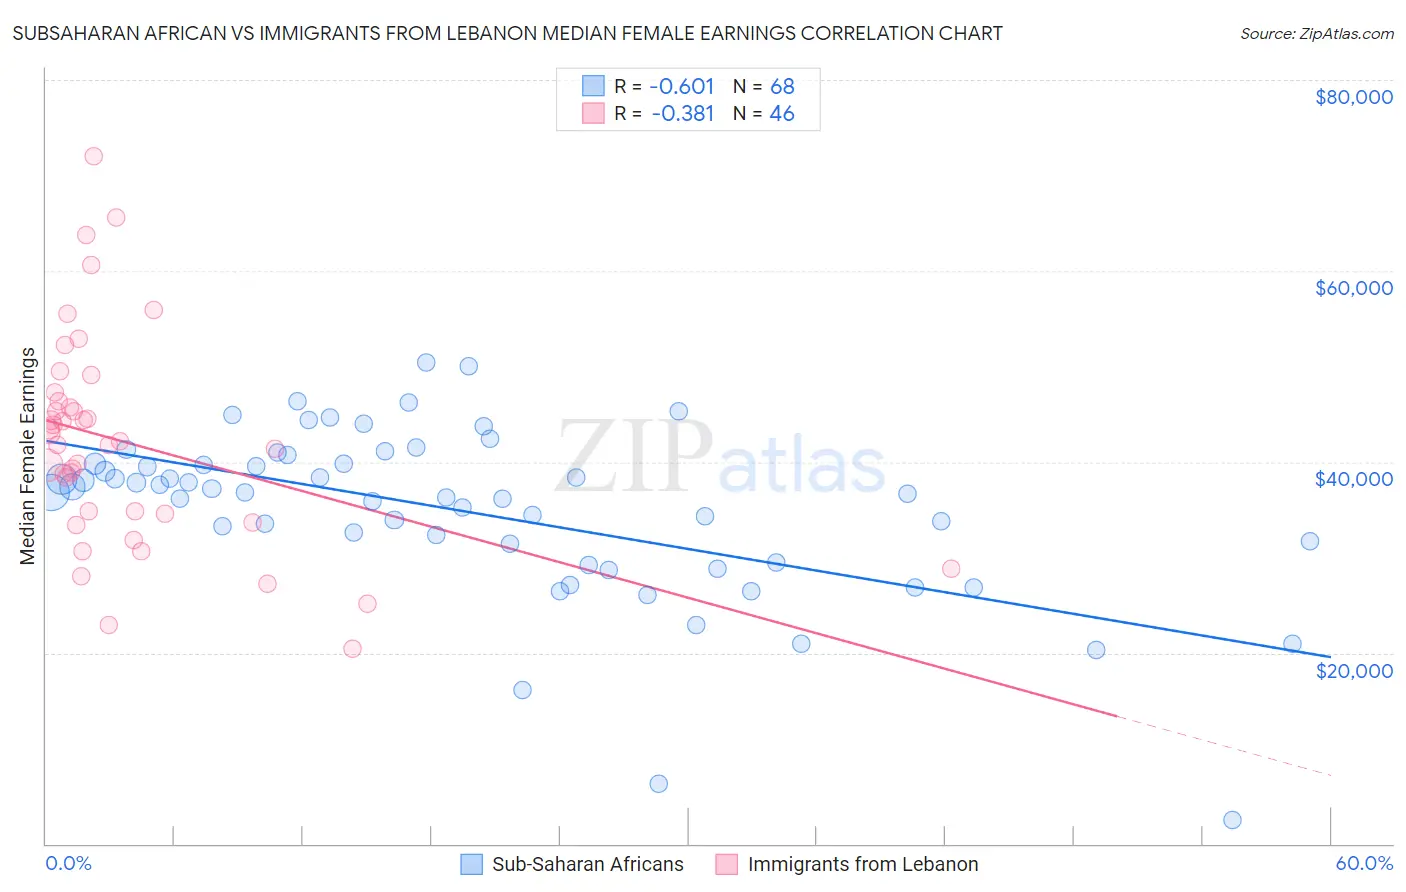
Subsaharan African vs Immigrants from Lebanon Median Female Earnings Correlation Chart
The statistical analysis conducted on geographies consisting of 507,707,888 people shows a significant negative correlation between the proportion of Sub-Saharan Africans and median female earnings in the United States with a correlation coefficient (R) of -0.601 and weighted average of $38,391. Similarly, the statistical analysis conducted on geographies consisting of 217,136,243 people shows a mild negative correlation between the proportion of Immigrants from Lebanon and median female earnings in the United States with a correlation coefficient (R) of -0.381 and weighted average of $41,183, a difference of 7.3%.
Median Female Earnings Correlation Summary
| Measurement | Subsaharan African | Immigrants from Lebanon |
| Minimum | $2,499 | $20,406 |
| Maximum | $50,416 | $72,000 |
| Range | $47,917 | $51,594 |
| Mean | $34,847 | $42,035 |
| Median | $36,829 | $41,983 |
| Interquartile 25% (IQ1) | $30,475 | $34,539 |
| Interquartile 75% (IQ3) | $39,811 | $46,364 |
| Interquartile Range (IQR) | $9,336 | $11,825 |
| Standard Deviation (Sample) | $8,928 | $11,071 |
| Standard Deviation (Population) | $8,863 | $10,950 |
Similar Demographics by Median Female Earnings
Demographics Similar to Sub-Saharan Africans by Median Female Earnings
In terms of median female earnings, the demographic groups most similar to Sub-Saharan Africans are Scottish ($38,397, a difference of 0.020%), Belgian ($38,382, a difference of 0.020%), Basque ($38,352, a difference of 0.10%), French Canadian ($38,436, a difference of 0.12%), and Somali ($38,333, a difference of 0.15%).
| Demographics | Rating | Rank | Median Female Earnings |
| Immigrants | Azores | 8.8 /100 | #221 | Tragic $38,573 |
| Japanese | 8.1 /100 | #222 | Tragic $38,528 |
| Immigrants | Sudan | 7.8 /100 | #223 | Tragic $38,511 |
| Native Hawaiians | 7.1 /100 | #224 | Tragic $38,461 |
| French | 7.0 /100 | #225 | Tragic $38,457 |
| French Canadians | 6.8 /100 | #226 | Tragic $38,436 |
| Scottish | 6.3 /100 | #227 | Tragic $38,397 |
| Sub-Saharan Africans | 6.2 /100 | #228 | Tragic $38,391 |
| Belgians | 6.1 /100 | #229 | Tragic $38,382 |
| Basques | 5.7 /100 | #230 | Tragic $38,352 |
| Somalis | 5.5 /100 | #231 | Tragic $38,333 |
| Scandinavians | 5.2 /100 | #232 | Tragic $38,306 |
| Tongans | 5.1 /100 | #233 | Tragic $38,288 |
| Celtics | 5.0 /100 | #234 | Tragic $38,283 |
| Sudanese | 4.4 /100 | #235 | Tragic $38,215 |
Demographics Similar to Immigrants from Lebanon by Median Female Earnings
In terms of median female earnings, the demographic groups most similar to Immigrants from Lebanon are Immigrants from Philippines ($41,114, a difference of 0.17%), Barbadian ($41,261, a difference of 0.19%), Immigrants from Brazil ($41,273, a difference of 0.22%), Immigrants from England ($41,277, a difference of 0.23%), and Korean ($41,276, a difference of 0.23%).
| Demographics | Rating | Rank | Median Female Earnings |
| Immigrants | Canada | 97.0 /100 | #111 | Exceptional $41,373 |
| Immigrants | North America | 96.7 /100 | #112 | Exceptional $41,319 |
| Macedonians | 96.4 /100 | #113 | Exceptional $41,286 |
| Immigrants | England | 96.4 /100 | #114 | Exceptional $41,277 |
| Koreans | 96.4 /100 | #115 | Exceptional $41,276 |
| Immigrants | Brazil | 96.4 /100 | #116 | Exceptional $41,273 |
| Barbadians | 96.3 /100 | #117 | Exceptional $41,261 |
| Immigrants | Lebanon | 95.6 /100 | #118 | Exceptional $41,183 |
| Immigrants | Philippines | 95.0 /100 | #119 | Exceptional $41,114 |
| Immigrants | Kuwait | 94.4 /100 | #120 | Exceptional $41,055 |
| Croatians | 93.7 /100 | #121 | Exceptional $40,993 |
| Immigrants | Jordan | 93.5 /100 | #122 | Exceptional $40,977 |
| Guyanese | 93.4 /100 | #123 | Exceptional $40,973 |
| Trinidadians and Tobagonians | 93.2 /100 | #124 | Exceptional $40,958 |
| Austrians | 92.7 /100 | #125 | Exceptional $40,923 |