Subsaharan African vs Immigrants from Japan Median Female Earnings
COMPARE
Subsaharan African
Immigrants from Japan
Median Female Earnings
Median Female Earnings Comparison
Sub-Saharan Africans
Immigrants from Japan
$38,391
MEDIAN FEMALE EARNINGS
6.2/ 100
METRIC RATING
228th/ 347
METRIC RANK
$45,323
MEDIAN FEMALE EARNINGS
100.0/ 100
METRIC RATING
20th/ 347
METRIC RANK
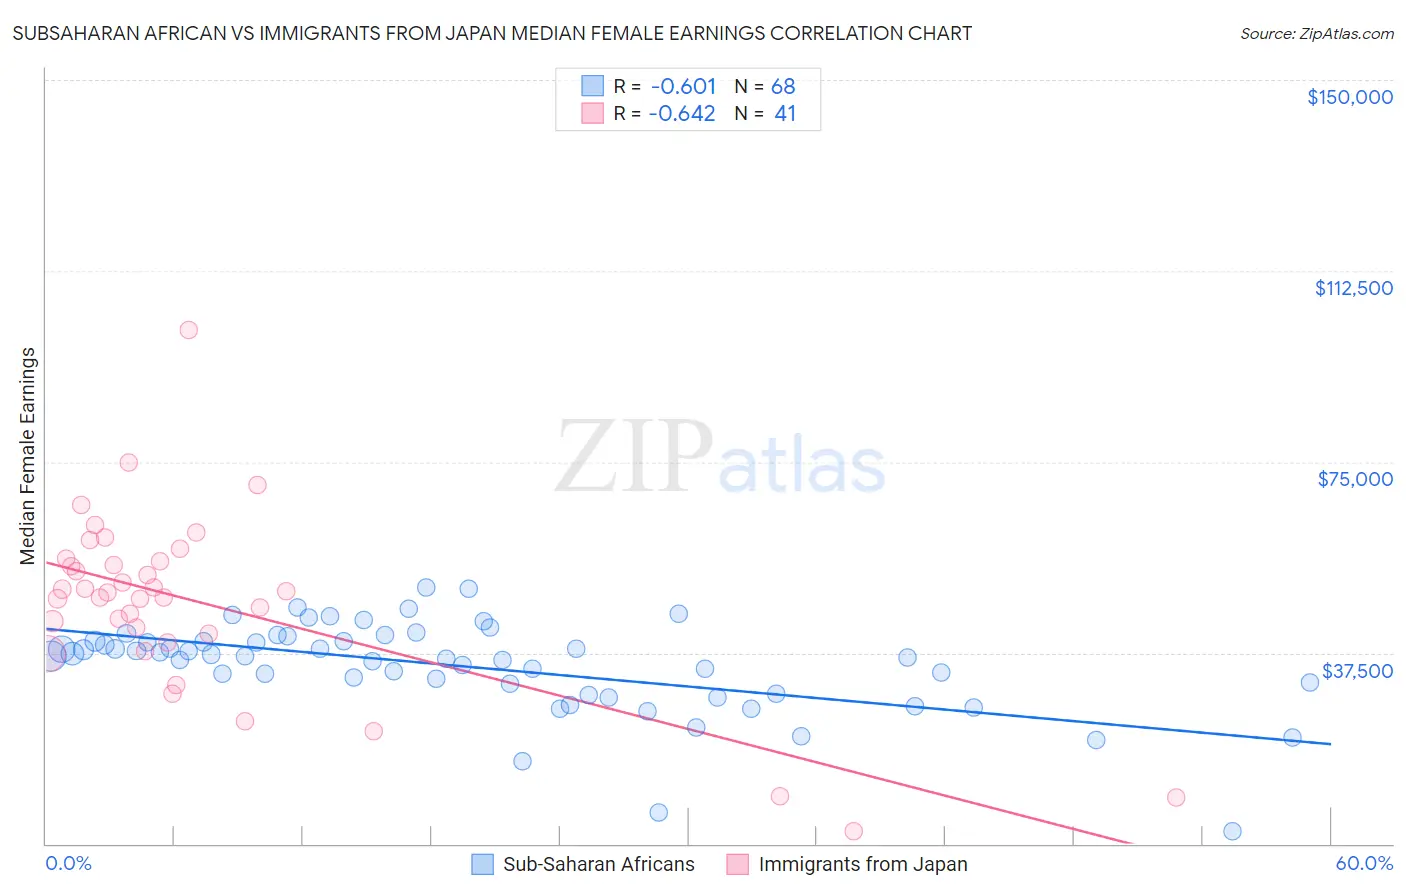
Subsaharan African vs Immigrants from Japan Median Female Earnings Correlation Chart
The statistical analysis conducted on geographies consisting of 507,707,888 people shows a significant negative correlation between the proportion of Sub-Saharan Africans and median female earnings in the United States with a correlation coefficient (R) of -0.601 and weighted average of $38,391. Similarly, the statistical analysis conducted on geographies consisting of 340,067,986 people shows a significant negative correlation between the proportion of Immigrants from Japan and median female earnings in the United States with a correlation coefficient (R) of -0.642 and weighted average of $45,323, a difference of 18.1%.
Median Female Earnings Correlation Summary
| Measurement | Subsaharan African | Immigrants from Japan |
| Minimum | $2,499 | $2,499 |
| Maximum | $50,416 | $100,821 |
| Range | $47,917 | $98,322 |
| Mean | $34,847 | $47,310 |
| Median | $36,829 | $49,462 |
| Interquartile 25% (IQ1) | $30,475 | $40,316 |
| Interquartile 75% (IQ3) | $39,811 | $55,693 |
| Interquartile Range (IQR) | $9,336 | $15,376 |
| Standard Deviation (Sample) | $8,928 | $17,852 |
| Standard Deviation (Population) | $8,863 | $17,633 |
Similar Demographics by Median Female Earnings
Demographics Similar to Sub-Saharan Africans by Median Female Earnings
In terms of median female earnings, the demographic groups most similar to Sub-Saharan Africans are Scottish ($38,397, a difference of 0.020%), Belgian ($38,382, a difference of 0.020%), Basque ($38,352, a difference of 0.10%), French Canadian ($38,436, a difference of 0.12%), and Somali ($38,333, a difference of 0.15%).
| Demographics | Rating | Rank | Median Female Earnings |
| Immigrants | Azores | 8.8 /100 | #221 | Tragic $38,573 |
| Japanese | 8.1 /100 | #222 | Tragic $38,528 |
| Immigrants | Sudan | 7.8 /100 | #223 | Tragic $38,511 |
| Native Hawaiians | 7.1 /100 | #224 | Tragic $38,461 |
| French | 7.0 /100 | #225 | Tragic $38,457 |
| French Canadians | 6.8 /100 | #226 | Tragic $38,436 |
| Scottish | 6.3 /100 | #227 | Tragic $38,397 |
| Sub-Saharan Africans | 6.2 /100 | #228 | Tragic $38,391 |
| Belgians | 6.1 /100 | #229 | Tragic $38,382 |
| Basques | 5.7 /100 | #230 | Tragic $38,352 |
| Somalis | 5.5 /100 | #231 | Tragic $38,333 |
| Scandinavians | 5.2 /100 | #232 | Tragic $38,306 |
| Tongans | 5.1 /100 | #233 | Tragic $38,288 |
| Celtics | 5.0 /100 | #234 | Tragic $38,283 |
| Sudanese | 4.4 /100 | #235 | Tragic $38,215 |
Demographics Similar to Immigrants from Japan by Median Female Earnings
In terms of median female earnings, the demographic groups most similar to Immigrants from Japan are Eastern European ($45,385, a difference of 0.14%), Cypriot ($45,570, a difference of 0.55%), Cambodian ($45,014, a difference of 0.69%), Immigrants from Greece ($44,976, a difference of 0.77%), and Burmese ($44,911, a difference of 0.92%).
| Demographics | Rating | Rank | Median Female Earnings |
| Immigrants | Australia | 100.0 /100 | #13 | Exceptional $46,573 |
| Soviet Union | 100.0 /100 | #14 | Exceptional $46,556 |
| Immigrants | Eastern Asia | 100.0 /100 | #15 | Exceptional $46,502 |
| Indians (Asian) | 100.0 /100 | #16 | Exceptional $46,481 |
| Immigrants | South Central Asia | 100.0 /100 | #17 | Exceptional $46,324 |
| Cypriots | 100.0 /100 | #18 | Exceptional $45,570 |
| Eastern Europeans | 100.0 /100 | #19 | Exceptional $45,385 |
| Immigrants | Japan | 100.0 /100 | #20 | Exceptional $45,323 |
| Cambodians | 100.0 /100 | #21 | Exceptional $45,014 |
| Immigrants | Greece | 100.0 /100 | #22 | Exceptional $44,976 |
| Burmese | 100.0 /100 | #23 | Exceptional $44,911 |
| Immigrants | Korea | 100.0 /100 | #24 | Exceptional $44,847 |
| Immigrants | Sweden | 100.0 /100 | #25 | Exceptional $44,774 |
| Immigrants | Belarus | 100.0 /100 | #26 | Exceptional $44,757 |
| Turks | 100.0 /100 | #27 | Exceptional $44,695 |