Subsaharan African vs Immigrants from Cambodia Median Female Earnings
COMPARE
Subsaharan African
Immigrants from Cambodia
Median Female Earnings
Median Female Earnings Comparison
Sub-Saharan Africans
Immigrants from Cambodia
$38,391
MEDIAN FEMALE EARNINGS
6.2/ 100
METRIC RATING
228th/ 347
METRIC RANK
$38,833
MEDIAN FEMALE EARNINGS
14.2/ 100
METRIC RATING
207th/ 347
METRIC RANK
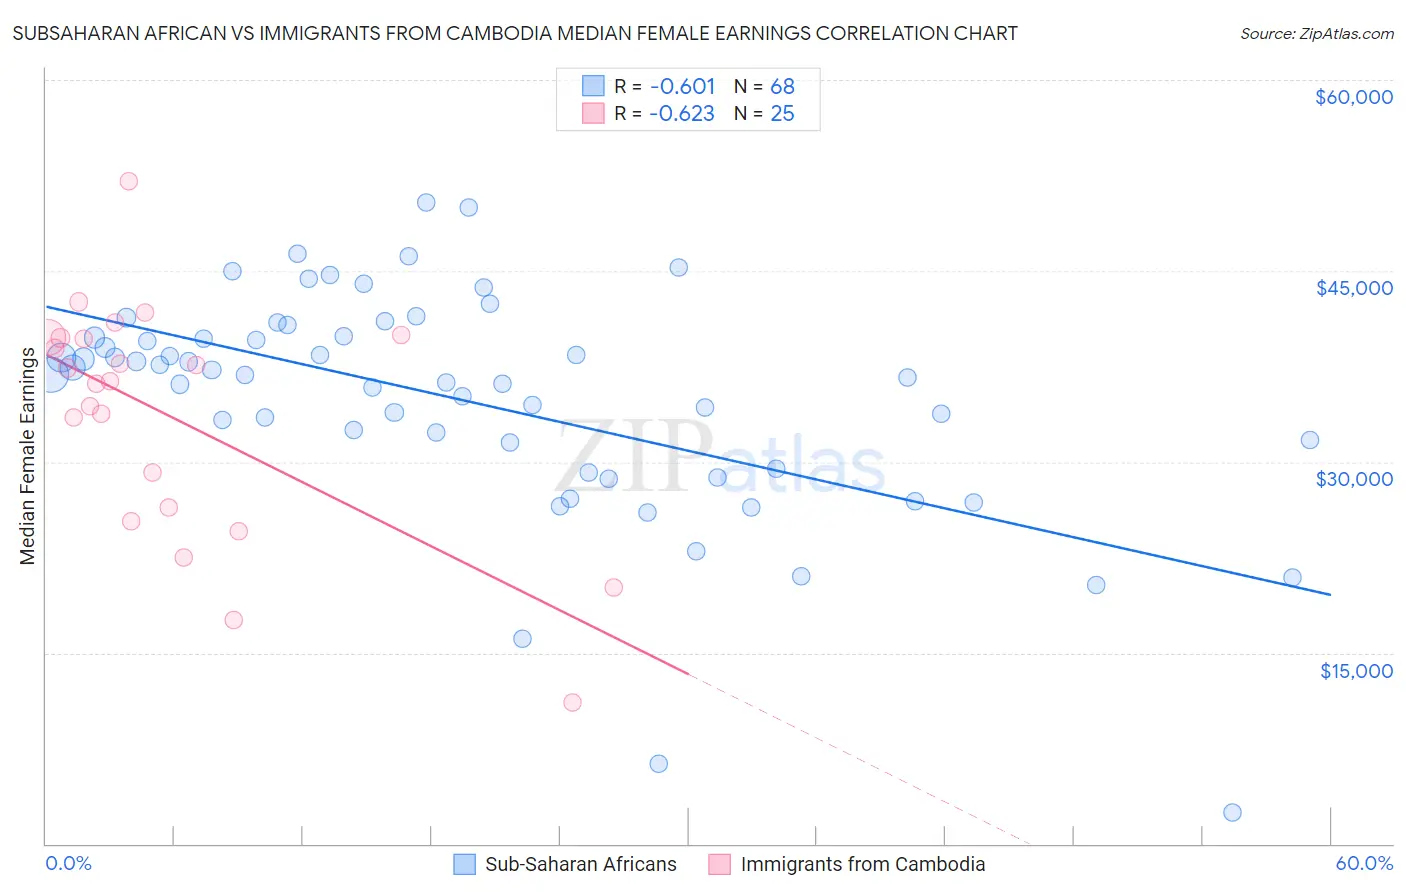
Subsaharan African vs Immigrants from Cambodia Median Female Earnings Correlation Chart
The statistical analysis conducted on geographies consisting of 507,707,888 people shows a significant negative correlation between the proportion of Sub-Saharan Africans and median female earnings in the United States with a correlation coefficient (R) of -0.601 and weighted average of $38,391. Similarly, the statistical analysis conducted on geographies consisting of 205,144,839 people shows a significant negative correlation between the proportion of Immigrants from Cambodia and median female earnings in the United States with a correlation coefficient (R) of -0.623 and weighted average of $38,833, a difference of 1.1%.
Median Female Earnings Correlation Summary
| Measurement | Subsaharan African | Immigrants from Cambodia |
| Minimum | $2,499 | $11,066 |
| Maximum | $50,416 | $52,046 |
| Range | $47,917 | $40,980 |
| Mean | $34,847 | $33,558 |
| Median | $36,829 | $36,286 |
| Interquartile 25% (IQ1) | $30,475 | $25,865 |
| Interquartile 75% (IQ3) | $39,811 | $39,745 |
| Interquartile Range (IQR) | $9,336 | $13,880 |
| Standard Deviation (Sample) | $8,928 | $9,295 |
| Standard Deviation (Population) | $8,863 | $9,107 |
Similar Demographics by Median Female Earnings
Demographics Similar to Sub-Saharan Africans by Median Female Earnings
In terms of median female earnings, the demographic groups most similar to Sub-Saharan Africans are Scottish ($38,397, a difference of 0.020%), Belgian ($38,382, a difference of 0.020%), Basque ($38,352, a difference of 0.10%), French Canadian ($38,436, a difference of 0.12%), and Somali ($38,333, a difference of 0.15%).
| Demographics | Rating | Rank | Median Female Earnings |
| Immigrants | Azores | 8.8 /100 | #221 | Tragic $38,573 |
| Japanese | 8.1 /100 | #222 | Tragic $38,528 |
| Immigrants | Sudan | 7.8 /100 | #223 | Tragic $38,511 |
| Native Hawaiians | 7.1 /100 | #224 | Tragic $38,461 |
| French | 7.0 /100 | #225 | Tragic $38,457 |
| French Canadians | 6.8 /100 | #226 | Tragic $38,436 |
| Scottish | 6.3 /100 | #227 | Tragic $38,397 |
| Sub-Saharan Africans | 6.2 /100 | #228 | Tragic $38,391 |
| Belgians | 6.1 /100 | #229 | Tragic $38,382 |
| Basques | 5.7 /100 | #230 | Tragic $38,352 |
| Somalis | 5.5 /100 | #231 | Tragic $38,333 |
| Scandinavians | 5.2 /100 | #232 | Tragic $38,306 |
| Tongans | 5.1 /100 | #233 | Tragic $38,288 |
| Celtics | 5.0 /100 | #234 | Tragic $38,283 |
| Sudanese | 4.4 /100 | #235 | Tragic $38,215 |
Demographics Similar to Immigrants from Cambodia by Median Female Earnings
In terms of median female earnings, the demographic groups most similar to Immigrants from Cambodia are Immigrants from Thailand ($38,810, a difference of 0.060%), Norwegian ($38,802, a difference of 0.080%), Immigrants from Bosnia and Herzegovina ($38,886, a difference of 0.14%), Immigrants from Colombia ($38,913, a difference of 0.20%), and Czechoslovakian ($38,738, a difference of 0.25%).
| Demographics | Rating | Rank | Median Female Earnings |
| Immigrants | Panama | 20.6 /100 | #200 | Fair $39,049 |
| Panamanians | 20.6 /100 | #201 | Fair $39,049 |
| Slovaks | 19.9 /100 | #202 | Poor $39,029 |
| Czechs | 18.7 /100 | #203 | Poor $38,992 |
| Immigrants | Uruguay | 17.3 /100 | #204 | Poor $38,945 |
| Immigrants | Colombia | 16.3 /100 | #205 | Poor $38,913 |
| Immigrants | Bosnia and Herzegovina | 15.6 /100 | #206 | Poor $38,886 |
| Immigrants | Cambodia | 14.2 /100 | #207 | Poor $38,833 |
| Immigrants | Thailand | 13.6 /100 | #208 | Poor $38,810 |
| Norwegians | 13.4 /100 | #209 | Poor $38,802 |
| Czechoslovakians | 12.0 /100 | #210 | Poor $38,738 |
| Aleuts | 11.6 /100 | #211 | Poor $38,719 |
| Guamanians/Chamorros | 11.5 /100 | #212 | Poor $38,717 |
| Jamaicans | 10.5 /100 | #213 | Poor $38,670 |
| Iraqis | 10.5 /100 | #214 | Poor $38,666 |