Subsaharan African vs Egyptian Median Female Earnings
COMPARE
Subsaharan African
Egyptian
Median Female Earnings
Median Female Earnings Comparison
Sub-Saharan Africans
Egyptians
$38,391
MEDIAN FEMALE EARNINGS
6.2/ 100
METRIC RATING
228th/ 347
METRIC RANK
$43,305
MEDIAN FEMALE EARNINGS
99.9/ 100
METRIC RATING
55th/ 347
METRIC RANK
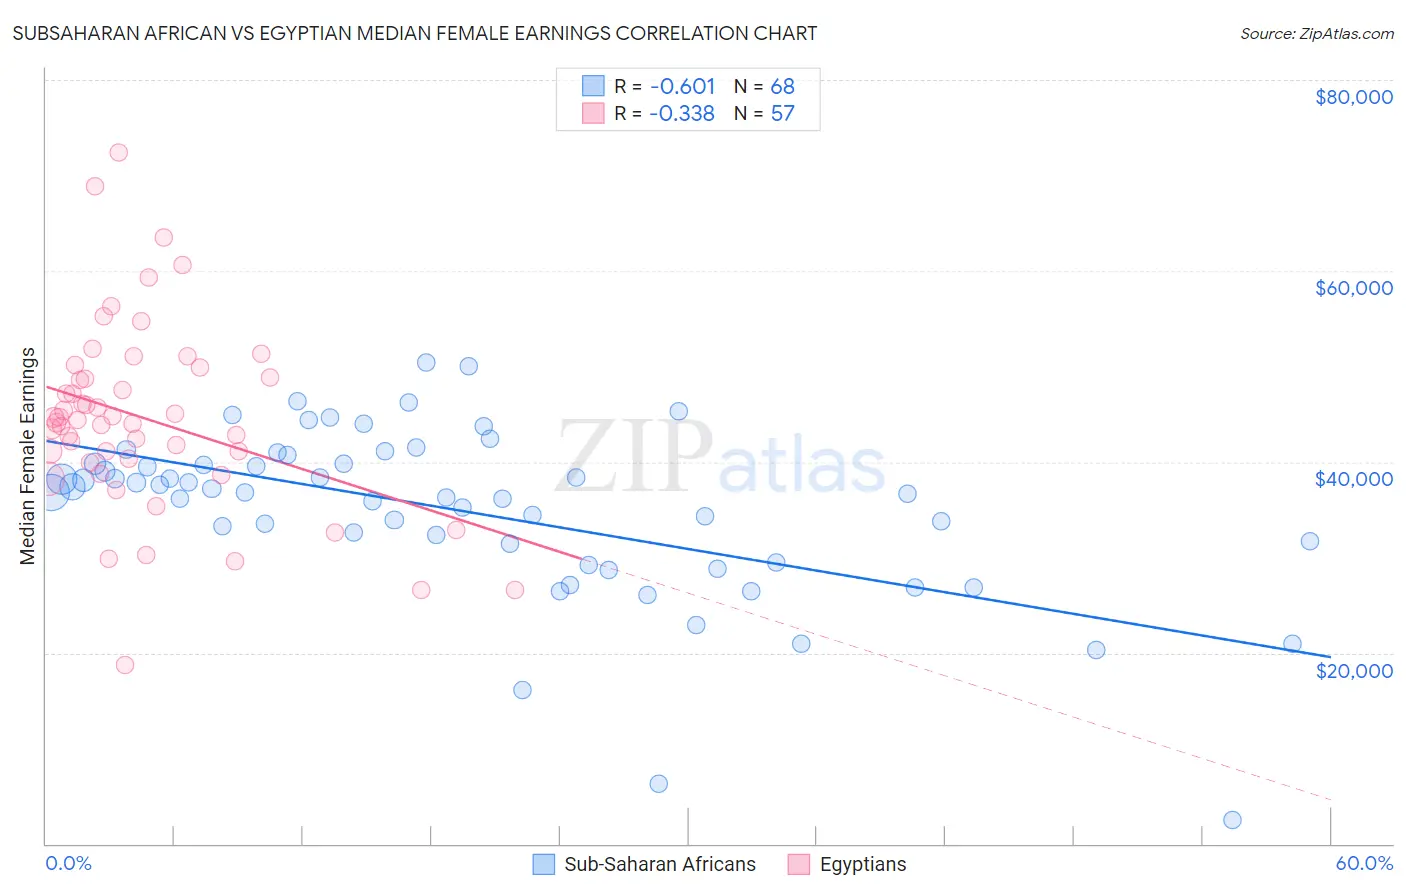
Subsaharan African vs Egyptian Median Female Earnings Correlation Chart
The statistical analysis conducted on geographies consisting of 507,707,888 people shows a significant negative correlation between the proportion of Sub-Saharan Africans and median female earnings in the United States with a correlation coefficient (R) of -0.601 and weighted average of $38,391. Similarly, the statistical analysis conducted on geographies consisting of 276,887,423 people shows a mild negative correlation between the proportion of Egyptians and median female earnings in the United States with a correlation coefficient (R) of -0.338 and weighted average of $43,305, a difference of 12.8%.
Median Female Earnings Correlation Summary
| Measurement | Subsaharan African | Egyptian |
| Minimum | $2,499 | $18,750 |
| Maximum | $50,416 | $72,362 |
| Range | $47,917 | $53,612 |
| Mean | $34,847 | $44,581 |
| Median | $36,829 | $44,449 |
| Interquartile 25% (IQ1) | $30,475 | $40,134 |
| Interquartile 75% (IQ3) | $39,811 | $49,358 |
| Interquartile Range (IQR) | $9,336 | $9,224 |
| Standard Deviation (Sample) | $8,928 | $9,878 |
| Standard Deviation (Population) | $8,863 | $9,791 |
Similar Demographics by Median Female Earnings
Demographics Similar to Sub-Saharan Africans by Median Female Earnings
In terms of median female earnings, the demographic groups most similar to Sub-Saharan Africans are Scottish ($38,397, a difference of 0.020%), Belgian ($38,382, a difference of 0.020%), Basque ($38,352, a difference of 0.10%), French Canadian ($38,436, a difference of 0.12%), and Somali ($38,333, a difference of 0.15%).
| Demographics | Rating | Rank | Median Female Earnings |
| Immigrants | Azores | 8.8 /100 | #221 | Tragic $38,573 |
| Japanese | 8.1 /100 | #222 | Tragic $38,528 |
| Immigrants | Sudan | 7.8 /100 | #223 | Tragic $38,511 |
| Native Hawaiians | 7.1 /100 | #224 | Tragic $38,461 |
| French | 7.0 /100 | #225 | Tragic $38,457 |
| French Canadians | 6.8 /100 | #226 | Tragic $38,436 |
| Scottish | 6.3 /100 | #227 | Tragic $38,397 |
| Sub-Saharan Africans | 6.2 /100 | #228 | Tragic $38,391 |
| Belgians | 6.1 /100 | #229 | Tragic $38,382 |
| Basques | 5.7 /100 | #230 | Tragic $38,352 |
| Somalis | 5.5 /100 | #231 | Tragic $38,333 |
| Scandinavians | 5.2 /100 | #232 | Tragic $38,306 |
| Tongans | 5.1 /100 | #233 | Tragic $38,288 |
| Celtics | 5.0 /100 | #234 | Tragic $38,283 |
| Sudanese | 4.4 /100 | #235 | Tragic $38,215 |
Demographics Similar to Egyptians by Median Female Earnings
In terms of median female earnings, the demographic groups most similar to Egyptians are Immigrants from Eastern Europe ($43,309, a difference of 0.010%), Australian ($43,308, a difference of 0.010%), Immigrants from Lithuania ($43,317, a difference of 0.030%), Immigrants from Croatia ($43,258, a difference of 0.11%), and Maltese ($43,357, a difference of 0.12%).
| Demographics | Rating | Rank | Median Female Earnings |
| Immigrants | Indonesia | 100.0 /100 | #48 | Exceptional $43,412 |
| Immigrants | Serbia | 100.0 /100 | #49 | Exceptional $43,385 |
| Immigrants | Uzbekistan | 100.0 /100 | #50 | Exceptional $43,363 |
| Maltese | 100.0 /100 | #51 | Exceptional $43,357 |
| Immigrants | Lithuania | 99.9 /100 | #52 | Exceptional $43,317 |
| Immigrants | Eastern Europe | 99.9 /100 | #53 | Exceptional $43,309 |
| Australians | 99.9 /100 | #54 | Exceptional $43,308 |
| Egyptians | 99.9 /100 | #55 | Exceptional $43,305 |
| Immigrants | Croatia | 99.9 /100 | #56 | Exceptional $43,258 |
| Ethiopians | 99.9 /100 | #57 | Exceptional $43,243 |
| Paraguayans | 99.9 /100 | #58 | Exceptional $43,173 |
| Estonians | 99.9 /100 | #59 | Exceptional $43,106 |
| Immigrants | Latvia | 99.9 /100 | #60 | Exceptional $43,099 |
| Immigrants | Bulgaria | 99.9 /100 | #61 | Exceptional $43,085 |
| Afghans | 99.9 /100 | #62 | Exceptional $43,077 |