Subsaharan African vs Alsatian Currently Married
COMPARE
Subsaharan African
Alsatian
Currently Married
Currently Married Comparison
Sub-Saharan Africans
Alsatians
42.6%
CURRENTLY MARRIED
0.0/ 100
METRIC RATING
292nd/ 347
METRIC RANK
45.7%
CURRENTLY MARRIED
10.8/ 100
METRIC RATING
208th/ 347
METRIC RANK
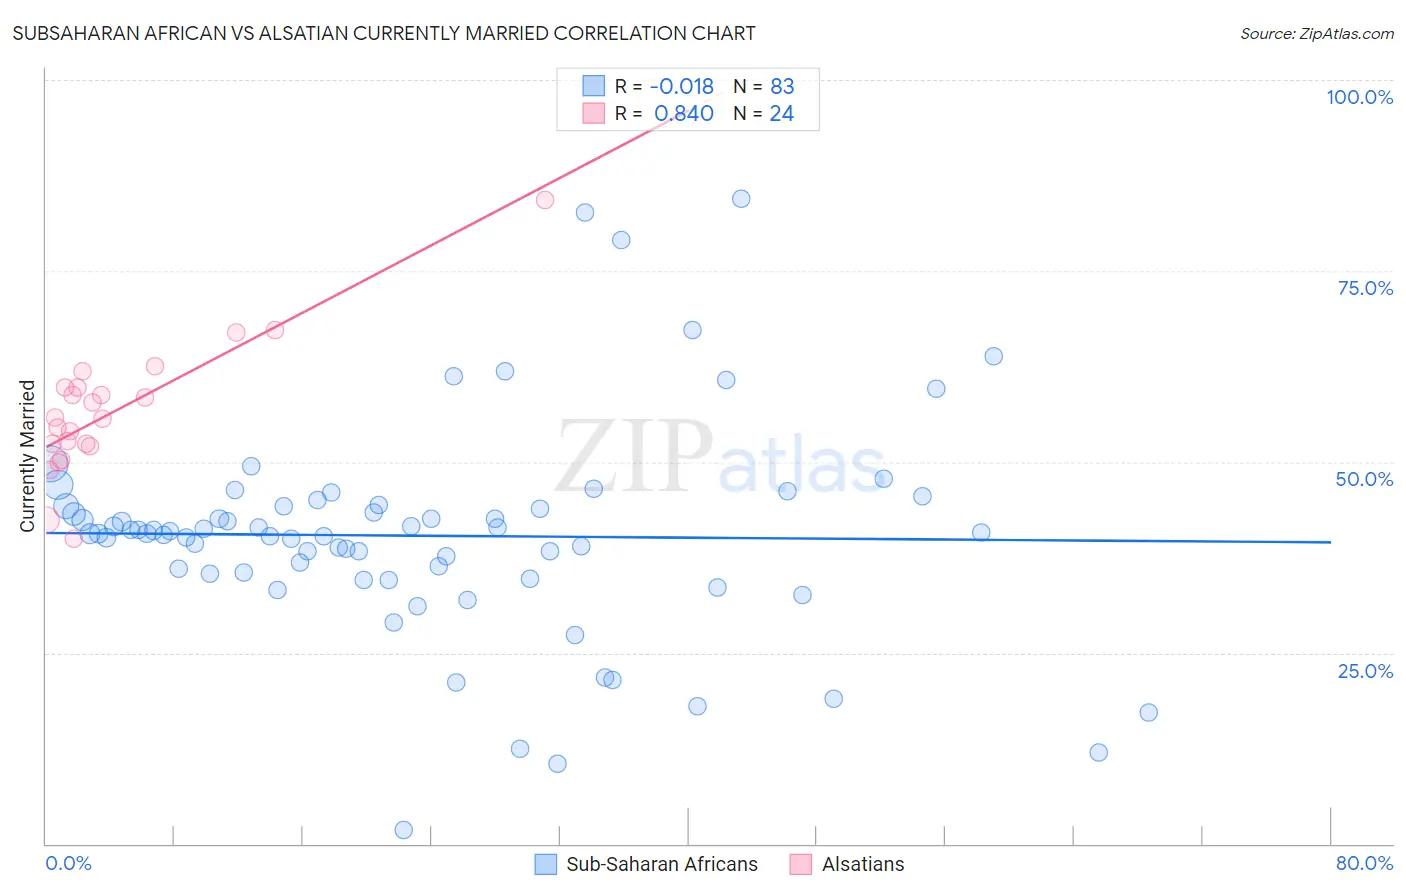
Subsaharan African vs Alsatian Currently Married Correlation Chart
The statistical analysis conducted on geographies consisting of 508,112,533 people shows no correlation between the proportion of Sub-Saharan Africans and percentage of population currently married in the United States with a correlation coefficient (R) of -0.018 and weighted average of 42.6%. Similarly, the statistical analysis conducted on geographies consisting of 82,681,658 people shows a very strong positive correlation between the proportion of Alsatians and percentage of population currently married in the United States with a correlation coefficient (R) of 0.840 and weighted average of 45.7%, a difference of 7.4%.
Currently Married Correlation Summary
| Measurement | Subsaharan African | Alsatian |
| Minimum | 1.8% | 39.9% |
| Maximum | 84.5% | 84.3% |
| Range | 82.7% | 44.4% |
| Mean | 40.3% | 56.5% |
| Median | 40.7% | 55.7% |
| Interquartile 25% (IQ1) | 35.4% | 52.2% |
| Interquartile 75% (IQ3) | 44.3% | 59.7% |
| Interquartile Range (IQR) | 8.9% | 7.5% |
| Standard Deviation (Sample) | 14.0% | 8.8% |
| Standard Deviation (Population) | 13.9% | 8.6% |
Similar Demographics by Currently Married
Demographics Similar to Sub-Saharan Africans by Currently Married
In terms of currently married, the demographic groups most similar to Sub-Saharan Africans are Yuman (42.6%, a difference of 0.020%), Honduran (42.5%, a difference of 0.14%), Immigrants from Guatemala (42.6%, a difference of 0.16%), Immigrants from Ghana (42.7%, a difference of 0.27%), and Paiute (42.7%, a difference of 0.28%).
| Demographics | Rating | Rank | Currently Married |
| Immigrants | Middle Africa | 0.0 /100 | #285 | Tragic 43.0% |
| Ghanaians | 0.0 /100 | #286 | Tragic 42.9% |
| Guatemalans | 0.0 /100 | #287 | Tragic 42.9% |
| Natives/Alaskans | 0.0 /100 | #288 | Tragic 42.8% |
| Paiute | 0.0 /100 | #289 | Tragic 42.7% |
| Immigrants | Ghana | 0.0 /100 | #290 | Tragic 42.7% |
| Immigrants | Guatemala | 0.0 /100 | #291 | Tragic 42.6% |
| Sub-Saharan Africans | 0.0 /100 | #292 | Tragic 42.6% |
| Yuman | 0.0 /100 | #293 | Tragic 42.6% |
| Hondurans | 0.0 /100 | #294 | Tragic 42.5% |
| Immigrants | Western Africa | 0.0 /100 | #295 | Tragic 42.4% |
| Menominee | 0.0 /100 | #296 | Tragic 42.3% |
| Cheyenne | 0.0 /100 | #297 | Tragic 42.2% |
| Immigrants | Honduras | 0.0 /100 | #298 | Tragic 42.2% |
| Liberians | 0.0 /100 | #299 | Tragic 42.2% |
Demographics Similar to Alsatians by Currently Married
In terms of currently married, the demographic groups most similar to Alsatians are Immigrants from South America (45.7%, a difference of 0.010%), Immigrants (45.8%, a difference of 0.050%), South American Indian (45.8%, a difference of 0.070%), Immigrants from Spain (45.8%, a difference of 0.080%), and Taiwanese (45.8%, a difference of 0.090%).
| Demographics | Rating | Rank | Currently Married |
| Malaysians | 15.3 /100 | #201 | Poor 45.9% |
| Immigrants | Albania | 14.5 /100 | #202 | Poor 45.9% |
| Taiwanese | 11.7 /100 | #203 | Poor 45.8% |
| Immigrants | Spain | 11.6 /100 | #204 | Poor 45.8% |
| South American Indians | 11.5 /100 | #205 | Poor 45.8% |
| Immigrants | Immigrants | 11.2 /100 | #206 | Poor 45.8% |
| Immigrants | South America | 10.8 /100 | #207 | Poor 45.7% |
| Alsatians | 10.8 /100 | #208 | Poor 45.7% |
| Immigrants | Micronesia | 8.8 /100 | #209 | Tragic 45.6% |
| Uruguayans | 7.9 /100 | #210 | Tragic 45.6% |
| Houma | 7.2 /100 | #211 | Tragic 45.5% |
| Marshallese | 7.2 /100 | #212 | Tragic 45.5% |
| Alaska Natives | 7.0 /100 | #213 | Tragic 45.5% |
| Dutch West Indians | 6.7 /100 | #214 | Tragic 45.5% |
| German Russians | 6.7 /100 | #215 | Tragic 45.5% |