French Canadian vs Alsatian Householder Income Over 65 years
COMPARE
French Canadian
Alsatian
Householder Income Over 65 years
Householder Income Over 65 years Comparison
French Canadians
Alsatians
$57,975
HOUSEHOLDER INCOME OVER 65 YEARS
4.2/ 100
METRIC RATING
226th/ 347
METRIC RANK
$61,797
HOUSEHOLDER INCOME OVER 65 YEARS
70.5/ 100
METRIC RATING
148th/ 347
METRIC RANK
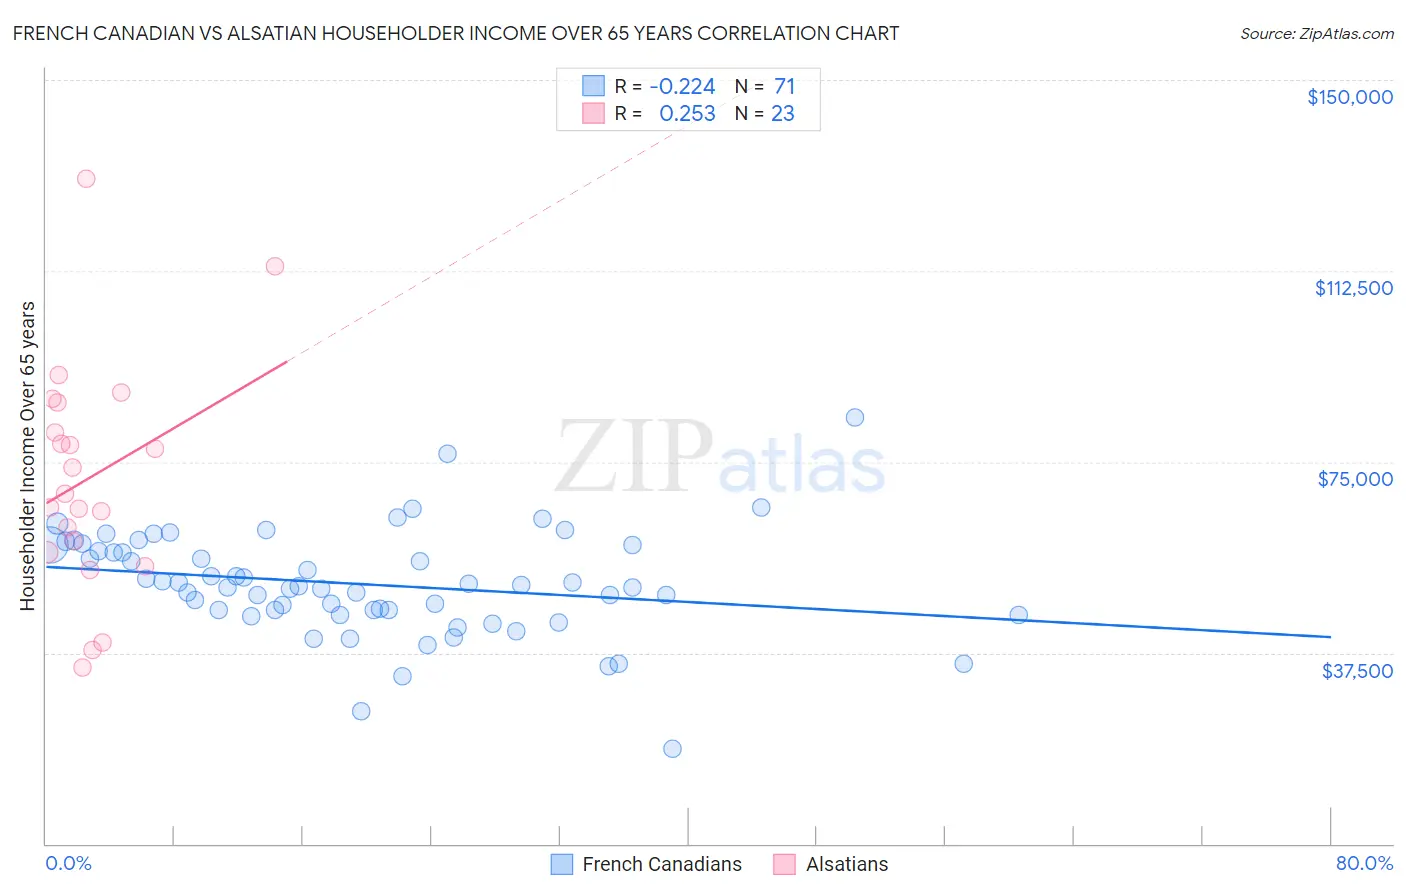
French Canadian vs Alsatian Householder Income Over 65 years Correlation Chart
The statistical analysis conducted on geographies consisting of 499,919,017 people shows a weak negative correlation between the proportion of French Canadians and household income with householder over the age of 65 in the United States with a correlation coefficient (R) of -0.224 and weighted average of $57,975. Similarly, the statistical analysis conducted on geographies consisting of 82,660,993 people shows a weak positive correlation between the proportion of Alsatians and household income with householder over the age of 65 in the United States with a correlation coefficient (R) of 0.253 and weighted average of $61,797, a difference of 6.6%.
Householder Income Over 65 years Correlation Summary
| Measurement | French Canadian | Alsatian |
| Minimum | $18,750 | $34,700 |
| Maximum | $83,631 | $130,500 |
| Range | $64,881 | $95,800 |
| Mean | $51,013 | $71,864 |
| Median | $50,515 | $68,750 |
| Interquartile 25% (IQ1) | $45,820 | $57,175 |
| Interquartile 75% (IQ3) | $58,631 | $86,740 |
| Interquartile Range (IQR) | $12,810 | $29,565 |
| Standard Deviation (Sample) | $10,428 | $22,665 |
| Standard Deviation (Population) | $10,355 | $22,167 |
Similar Demographics by Householder Income Over 65 years
Demographics Similar to French Canadians by Householder Income Over 65 years
In terms of householder income over 65 years, the demographic groups most similar to French Canadians are Venezuelan ($58,026, a difference of 0.090%), Japanese ($57,919, a difference of 0.10%), Immigrants from Albania ($57,828, a difference of 0.25%), Bermudan ($58,171, a difference of 0.34%), and Tsimshian ($58,202, a difference of 0.39%).
| Demographics | Rating | Rank | Householder Income Over 65 years |
| Malaysians | 5.5 /100 | #219 | Tragic $58,244 |
| Yugoslavians | 5.5 /100 | #220 | Tragic $58,243 |
| Immigrants | El Salvador | 5.4 /100 | #221 | Tragic $58,226 |
| Delaware | 5.3 /100 | #222 | Tragic $58,214 |
| Tsimshian | 5.2 /100 | #223 | Tragic $58,202 |
| Bermudans | 5.1 /100 | #224 | Tragic $58,171 |
| Venezuelans | 4.4 /100 | #225 | Tragic $58,026 |
| French Canadians | 4.2 /100 | #226 | Tragic $57,975 |
| Japanese | 3.9 /100 | #227 | Tragic $57,919 |
| Immigrants | Albania | 3.6 /100 | #228 | Tragic $57,828 |
| Immigrants | Colombia | 3.0 /100 | #229 | Tragic $57,658 |
| Immigrants | Cambodia | 2.8 /100 | #230 | Tragic $57,580 |
| Immigrants | Nonimmigrants | 2.4 /100 | #231 | Tragic $57,426 |
| Immigrants | Venezuela | 2.3 /100 | #232 | Tragic $57,371 |
| Immigrants | Western Africa | 1.7 /100 | #233 | Tragic $57,119 |
Demographics Similar to Alsatians by Householder Income Over 65 years
In terms of householder income over 65 years, the demographic groups most similar to Alsatians are Immigrants from Nepal ($61,843, a difference of 0.070%), Scottish ($61,735, a difference of 0.10%), Slavic ($61,709, a difference of 0.14%), Immigrants from Southern Europe ($61,902, a difference of 0.17%), and Hungarian ($61,673, a difference of 0.20%).
| Demographics | Rating | Rank | Householder Income Over 65 years |
| Canadians | 79.0 /100 | #141 | Good $62,230 |
| South American Indians | 78.7 /100 | #142 | Good $62,215 |
| Immigrants | Belarus | 77.8 /100 | #143 | Good $62,162 |
| Immigrants | Peru | 74.4 /100 | #144 | Good $61,988 |
| Immigrants | Uganda | 74.2 /100 | #145 | Good $61,976 |
| Immigrants | Southern Europe | 72.7 /100 | #146 | Good $61,902 |
| Immigrants | Nepal | 71.4 /100 | #147 | Good $61,843 |
| Alsatians | 70.5 /100 | #148 | Good $61,797 |
| Scottish | 69.1 /100 | #149 | Good $61,735 |
| Slavs | 68.5 /100 | #150 | Good $61,709 |
| Hungarians | 67.7 /100 | #151 | Good $61,673 |
| Armenians | 67.3 /100 | #152 | Good $61,656 |
| Costa Ricans | 66.9 /100 | #153 | Good $61,638 |
| Swiss | 66.5 /100 | #154 | Good $61,621 |
| Poles | 65.9 /100 | #155 | Good $61,598 |