American vs Alsatian Householder Income Over 65 years
COMPARE
American
Alsatian
Householder Income Over 65 years
Householder Income Over 65 years Comparison
Americans
Alsatians
$55,527
HOUSEHOLDER INCOME OVER 65 YEARS
0.3/ 100
METRIC RATING
254th/ 347
METRIC RANK
$61,797
HOUSEHOLDER INCOME OVER 65 YEARS
70.5/ 100
METRIC RATING
148th/ 347
METRIC RANK
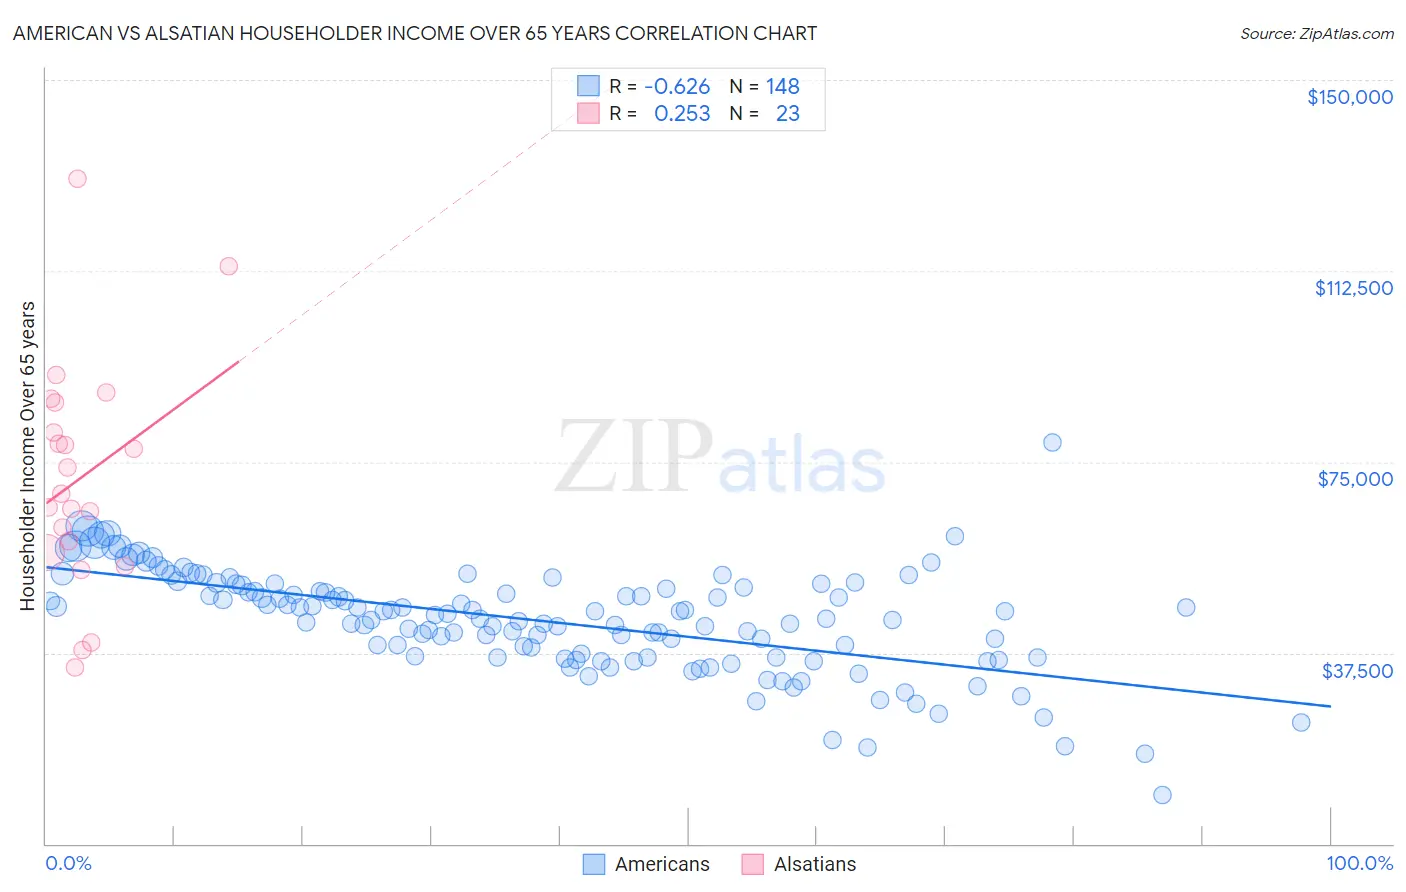
American vs Alsatian Householder Income Over 65 years Correlation Chart
The statistical analysis conducted on geographies consisting of 575,586,955 people shows a significant negative correlation between the proportion of Americans and household income with householder over the age of 65 in the United States with a correlation coefficient (R) of -0.626 and weighted average of $55,527. Similarly, the statistical analysis conducted on geographies consisting of 82,660,993 people shows a weak positive correlation between the proportion of Alsatians and household income with householder over the age of 65 in the United States with a correlation coefficient (R) of 0.253 and weighted average of $61,797, a difference of 11.3%.
Householder Income Over 65 years Correlation Summary
| Measurement | American | Alsatian |
| Minimum | $9,474 | $34,700 |
| Maximum | $78,750 | $130,500 |
| Range | $69,276 | $95,800 |
| Mean | $43,883 | $71,864 |
| Median | $45,063 | $68,750 |
| Interquartile 25% (IQ1) | $36,777 | $57,175 |
| Interquartile 75% (IQ3) | $50,543 | $86,740 |
| Interquartile Range (IQR) | $13,765 | $29,565 |
| Standard Deviation (Sample) | $10,175 | $22,665 |
| Standard Deviation (Population) | $10,140 | $22,167 |
Similar Demographics by Householder Income Over 65 years
Demographics Similar to Americans by Householder Income Over 65 years
In terms of householder income over 65 years, the demographic groups most similar to Americans are Immigrants from Trinidad and Tobago ($55,598, a difference of 0.13%), Immigrants from Bangladesh ($55,394, a difference of 0.24%), Osage ($55,677, a difference of 0.27%), German Russian ($55,356, a difference of 0.31%), and Trinidadian and Tobagonian ($55,327, a difference of 0.36%).
| Demographics | Rating | Rank | Householder Income Over 65 years |
| Yakama | 0.7 /100 | #247 | Tragic $56,234 |
| Vietnamese | 0.6 /100 | #248 | Tragic $56,143 |
| Mexican American Indians | 0.6 /100 | #249 | Tragic $56,089 |
| Immigrants | Bosnia and Herzegovina | 0.5 /100 | #250 | Tragic $55,986 |
| Immigrants | Portugal | 0.5 /100 | #251 | Tragic $55,924 |
| Osage | 0.4 /100 | #252 | Tragic $55,677 |
| Immigrants | Trinidad and Tobago | 0.4 /100 | #253 | Tragic $55,598 |
| Americans | 0.3 /100 | #254 | Tragic $55,527 |
| Immigrants | Bangladesh | 0.3 /100 | #255 | Tragic $55,394 |
| German Russians | 0.3 /100 | #256 | Tragic $55,356 |
| Trinidadians and Tobagonians | 0.3 /100 | #257 | Tragic $55,327 |
| Ecuadorians | 0.2 /100 | #258 | Tragic $54,958 |
| West Indians | 0.2 /100 | #259 | Tragic $54,936 |
| Immigrants | West Indies | 0.2 /100 | #260 | Tragic $54,927 |
| Comanche | 0.2 /100 | #261 | Tragic $54,922 |
Demographics Similar to Alsatians by Householder Income Over 65 years
In terms of householder income over 65 years, the demographic groups most similar to Alsatians are Immigrants from Nepal ($61,843, a difference of 0.070%), Scottish ($61,735, a difference of 0.10%), Slavic ($61,709, a difference of 0.14%), Immigrants from Southern Europe ($61,902, a difference of 0.17%), and Hungarian ($61,673, a difference of 0.20%).
| Demographics | Rating | Rank | Householder Income Over 65 years |
| Canadians | 79.0 /100 | #141 | Good $62,230 |
| South American Indians | 78.7 /100 | #142 | Good $62,215 |
| Immigrants | Belarus | 77.8 /100 | #143 | Good $62,162 |
| Immigrants | Peru | 74.4 /100 | #144 | Good $61,988 |
| Immigrants | Uganda | 74.2 /100 | #145 | Good $61,976 |
| Immigrants | Southern Europe | 72.7 /100 | #146 | Good $61,902 |
| Immigrants | Nepal | 71.4 /100 | #147 | Good $61,843 |
| Alsatians | 70.5 /100 | #148 | Good $61,797 |
| Scottish | 69.1 /100 | #149 | Good $61,735 |
| Slavs | 68.5 /100 | #150 | Good $61,709 |
| Hungarians | 67.7 /100 | #151 | Good $61,673 |
| Armenians | 67.3 /100 | #152 | Good $61,656 |
| Costa Ricans | 66.9 /100 | #153 | Good $61,638 |
| Swiss | 66.5 /100 | #154 | Good $61,621 |
| Poles | 65.9 /100 | #155 | Good $61,598 |