Hungarian vs Alsatian Householder Income Over 65 years
COMPARE
Hungarian
Alsatian
Householder Income Over 65 years
Householder Income Over 65 years Comparison
Hungarians
Alsatians
$61,673
HOUSEHOLDER INCOME OVER 65 YEARS
67.7/ 100
METRIC RATING
151st/ 347
METRIC RANK
$61,797
HOUSEHOLDER INCOME OVER 65 YEARS
70.5/ 100
METRIC RATING
148th/ 347
METRIC RANK
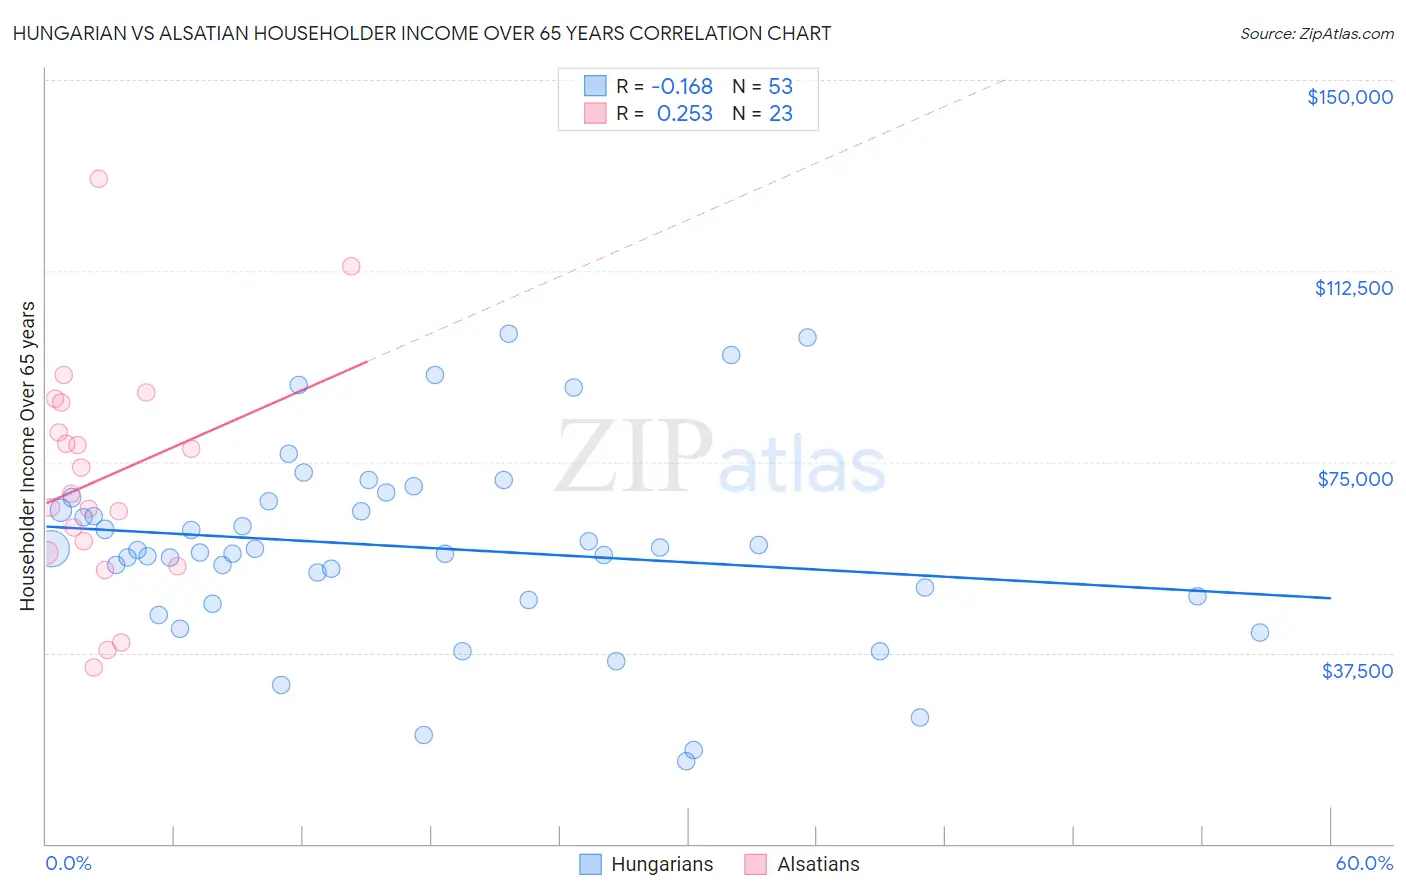
Hungarian vs Alsatian Householder Income Over 65 years Correlation Chart
The statistical analysis conducted on geographies consisting of 483,949,327 people shows a poor negative correlation between the proportion of Hungarians and household income with householder over the age of 65 in the United States with a correlation coefficient (R) of -0.168 and weighted average of $61,673. Similarly, the statistical analysis conducted on geographies consisting of 82,660,993 people shows a weak positive correlation between the proportion of Alsatians and household income with householder over the age of 65 in the United States with a correlation coefficient (R) of 0.253 and weighted average of $61,797, a difference of 0.20%.
Householder Income Over 65 years Correlation Summary
| Measurement | Hungarian | Alsatian |
| Minimum | $16,250 | $34,700 |
| Maximum | $100,190 | $130,500 |
| Range | $83,940 | $95,800 |
| Mean | $58,276 | $71,864 |
| Median | $57,812 | $68,750 |
| Interquartile 25% (IQ1) | $48,254 | $57,175 |
| Interquartile 75% (IQ3) | $67,733 | $86,740 |
| Interquartile Range (IQR) | $19,479 | $29,565 |
| Standard Deviation (Sample) | $18,944 | $22,665 |
| Standard Deviation (Population) | $18,765 | $22,167 |
Demographics Similar to Hungarians and Alsatians by Householder Income Over 65 years
In terms of householder income over 65 years, the demographic groups most similar to Hungarians are Armenian ($61,656, a difference of 0.030%), Slavic ($61,709, a difference of 0.060%), Costa Rican ($61,638, a difference of 0.060%), Swiss ($61,621, a difference of 0.080%), and Scottish ($61,735, a difference of 0.10%). Similarly, the demographic groups most similar to Alsatians are Immigrants from Nepal ($61,843, a difference of 0.070%), Scottish ($61,735, a difference of 0.10%), Slavic ($61,709, a difference of 0.14%), Immigrants from Southern Europe ($61,902, a difference of 0.17%), and Armenian ($61,656, a difference of 0.23%).
| Demographics | Rating | Rank | Householder Income Over 65 years |
| Lebanese | 79.9 /100 | #139 | Good $62,287 |
| Arabs | 79.6 /100 | #140 | Good $62,266 |
| Canadians | 79.0 /100 | #141 | Good $62,230 |
| South American Indians | 78.7 /100 | #142 | Good $62,215 |
| Immigrants | Belarus | 77.8 /100 | #143 | Good $62,162 |
| Immigrants | Peru | 74.4 /100 | #144 | Good $61,988 |
| Immigrants | Uganda | 74.2 /100 | #145 | Good $61,976 |
| Immigrants | Southern Europe | 72.7 /100 | #146 | Good $61,902 |
| Immigrants | Nepal | 71.4 /100 | #147 | Good $61,843 |
| Alsatians | 70.5 /100 | #148 | Good $61,797 |
| Scottish | 69.1 /100 | #149 | Good $61,735 |
| Slavs | 68.5 /100 | #150 | Good $61,709 |
| Hungarians | 67.7 /100 | #151 | Good $61,673 |
| Armenians | 67.3 /100 | #152 | Good $61,656 |
| Costa Ricans | 66.9 /100 | #153 | Good $61,638 |
| Swiss | 66.5 /100 | #154 | Good $61,621 |
| Poles | 65.9 /100 | #155 | Good $61,598 |
| Scandinavians | 65.6 /100 | #156 | Good $61,586 |
| Macedonians | 65.1 /100 | #157 | Good $61,564 |
| English | 63.3 /100 | #158 | Good $61,487 |
| Brazilians | 62.7 /100 | #159 | Good $61,465 |