Norwegian vs Alsatian Householder Income Over 65 years
COMPARE
Norwegian
Alsatian
Householder Income Over 65 years
Householder Income Over 65 years Comparison
Norwegians
Alsatians
$61,104
HOUSEHOLDER INCOME OVER 65 YEARS
53.6/ 100
METRIC RATING
167th/ 347
METRIC RANK
$61,797
HOUSEHOLDER INCOME OVER 65 YEARS
70.5/ 100
METRIC RATING
148th/ 347
METRIC RANK
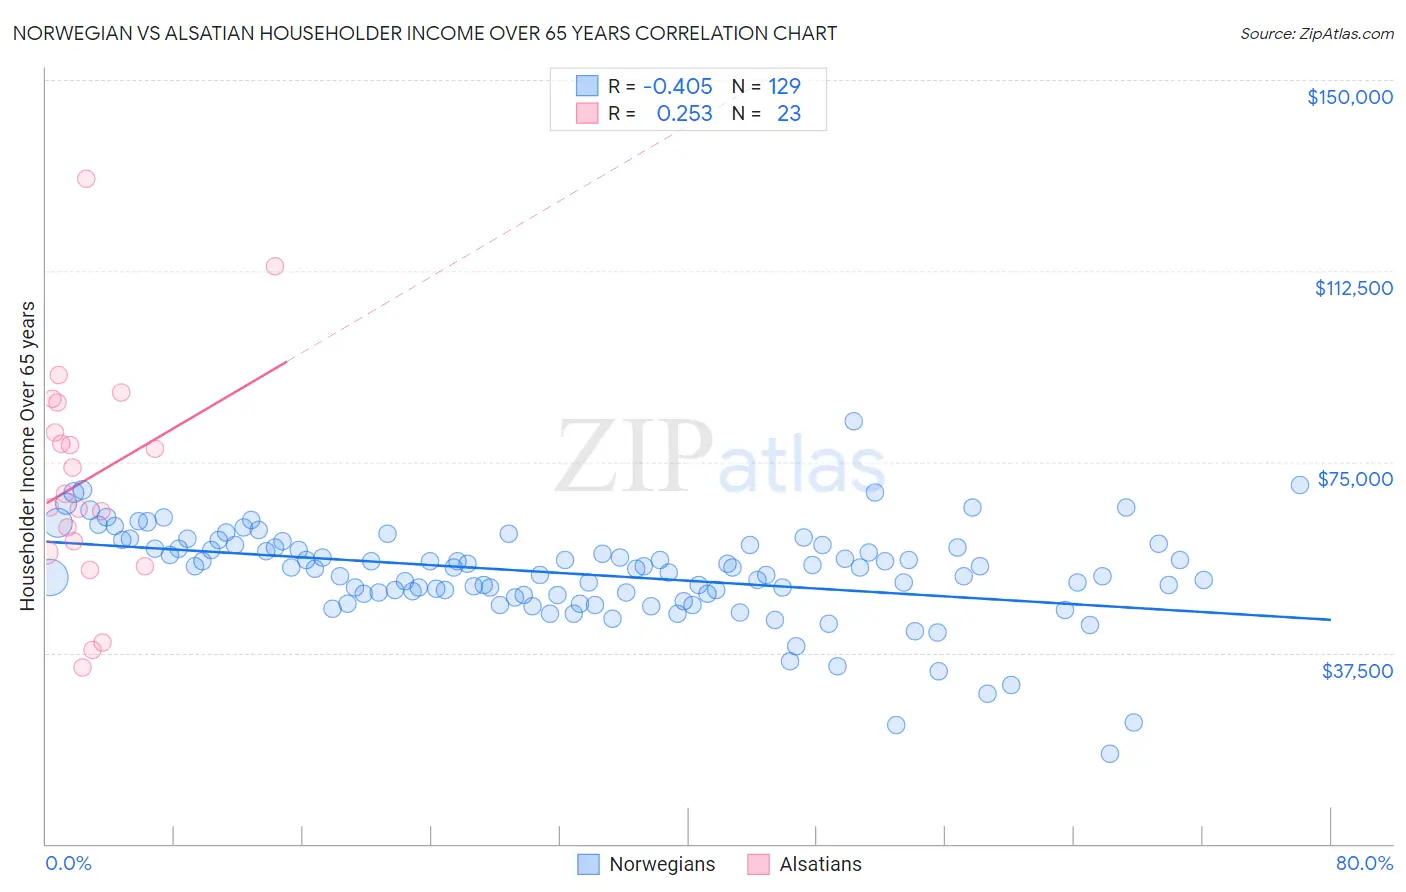
Norwegian vs Alsatian Householder Income Over 65 years Correlation Chart
The statistical analysis conducted on geographies consisting of 529,627,922 people shows a moderate negative correlation between the proportion of Norwegians and household income with householder over the age of 65 in the United States with a correlation coefficient (R) of -0.405 and weighted average of $61,104. Similarly, the statistical analysis conducted on geographies consisting of 82,660,993 people shows a weak positive correlation between the proportion of Alsatians and household income with householder over the age of 65 in the United States with a correlation coefficient (R) of 0.253 and weighted average of $61,797, a difference of 1.1%.
Householder Income Over 65 years Correlation Summary
| Measurement | Norwegian | Alsatian |
| Minimum | $17,624 | $34,700 |
| Maximum | $83,083 | $130,500 |
| Range | $65,458 | $95,800 |
| Mean | $53,000 | $71,864 |
| Median | $54,270 | $68,750 |
| Interquartile 25% (IQ1) | $49,000 | $57,175 |
| Interquartile 75% (IQ3) | $58,423 | $86,740 |
| Interquartile Range (IQR) | $9,422 | $29,565 |
| Standard Deviation (Sample) | $9,391 | $22,665 |
| Standard Deviation (Population) | $9,355 | $22,167 |
Demographics Similar to Norwegians and Alsatians by Householder Income Over 65 years
In terms of householder income over 65 years, the demographic groups most similar to Norwegians are Immigrants from Eastern Africa ($61,157, a difference of 0.090%), Immigrants from Ukraine ($61,163, a difference of 0.10%), Ugandan ($61,177, a difference of 0.12%), Immigrants from North Macedonia ($61,175, a difference of 0.12%), and Czech ($61,244, a difference of 0.23%). Similarly, the demographic groups most similar to Alsatians are Immigrants from Nepal ($61,843, a difference of 0.070%), Scottish ($61,735, a difference of 0.10%), Slavic ($61,709, a difference of 0.14%), Hungarian ($61,673, a difference of 0.20%), and Armenian ($61,656, a difference of 0.23%).
| Demographics | Rating | Rank | Householder Income Over 65 years |
| Immigrants | Nepal | 71.4 /100 | #147 | Good $61,843 |
| Alsatians | 70.5 /100 | #148 | Good $61,797 |
| Scottish | 69.1 /100 | #149 | Good $61,735 |
| Slavs | 68.5 /100 | #150 | Good $61,709 |
| Hungarians | 67.7 /100 | #151 | Good $61,673 |
| Armenians | 67.3 /100 | #152 | Good $61,656 |
| Costa Ricans | 66.9 /100 | #153 | Good $61,638 |
| Swiss | 66.5 /100 | #154 | Good $61,621 |
| Poles | 65.9 /100 | #155 | Good $61,598 |
| Scandinavians | 65.6 /100 | #156 | Good $61,586 |
| Macedonians | 65.1 /100 | #157 | Good $61,564 |
| English | 63.3 /100 | #158 | Good $61,487 |
| Brazilians | 62.7 /100 | #159 | Good $61,465 |
| Portuguese | 62.1 /100 | #160 | Good $61,440 |
| Icelanders | 57.9 /100 | #161 | Average $61,270 |
| Czechs | 57.2 /100 | #162 | Average $61,244 |
| Ugandans | 55.5 /100 | #163 | Average $61,177 |
| Immigrants | North Macedonia | 55.4 /100 | #164 | Average $61,175 |
| Immigrants | Ukraine | 55.1 /100 | #165 | Average $61,163 |
| Immigrants | Eastern Africa | 55.0 /100 | #166 | Average $61,157 |
| Norwegians | 53.6 /100 | #167 | Average $61,104 |