Spanish American Indian vs Immigrants from Malaysia Wage/Income Gap
COMPARE
Spanish American Indian
Immigrants from Malaysia
Wage/Income Gap
Wage/Income Gap Comparison
Spanish American Indians
Immigrants from Malaysia
22.5%
WAGE/INCOME GAP
100.0/ 100
METRIC RATING
64th/ 347
METRIC RANK
26.3%
WAGE/INCOME GAP
22.2/ 100
METRIC RATING
195th/ 347
METRIC RANK
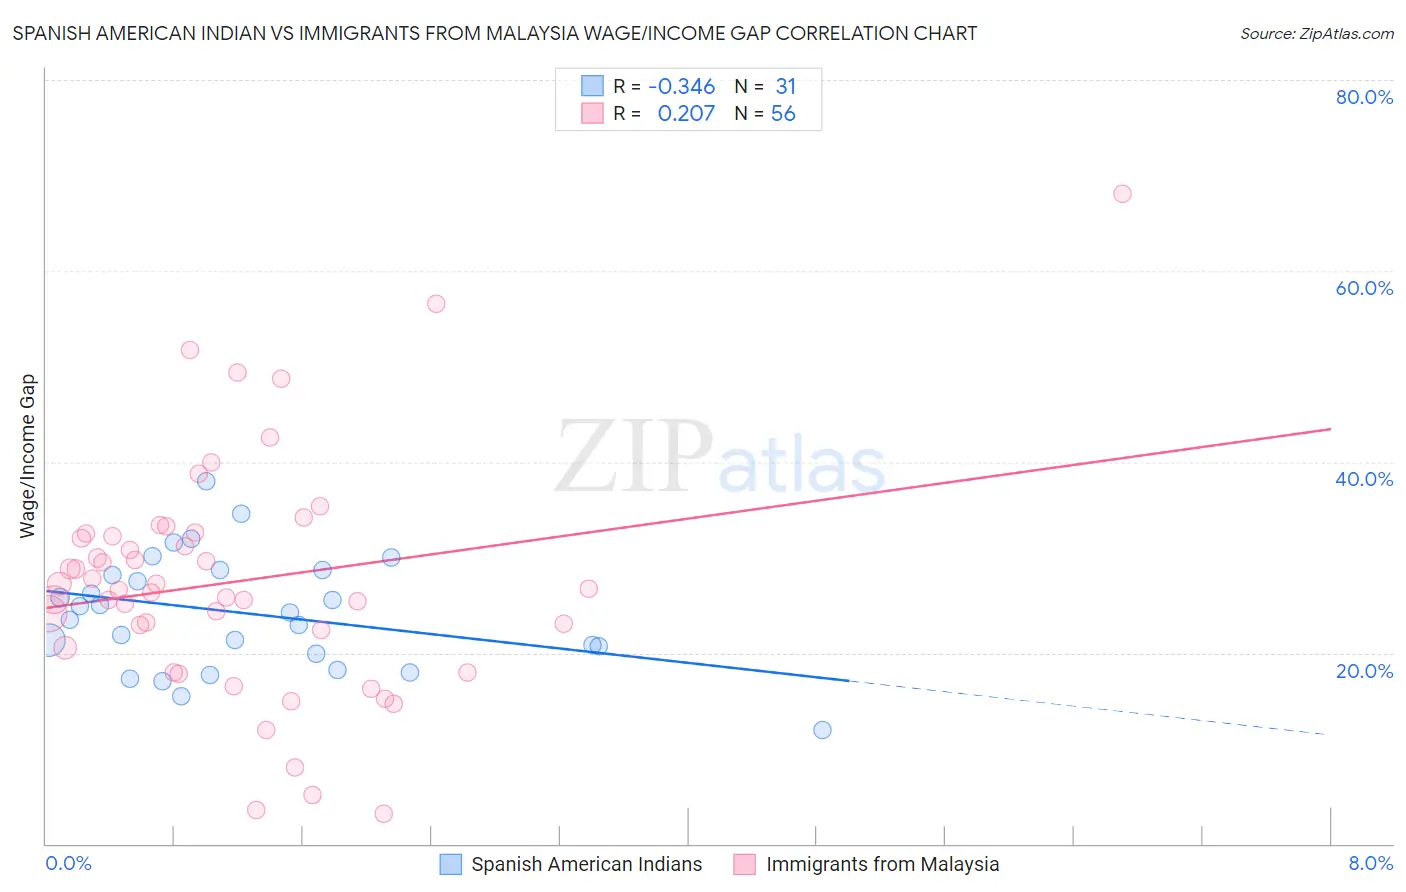
Spanish American Indian vs Immigrants from Malaysia Wage/Income Gap Correlation Chart
The statistical analysis conducted on geographies consisting of 73,143,386 people shows a mild negative correlation between the proportion of Spanish American Indians and wage/income gap percentage in the United States with a correlation coefficient (R) of -0.346 and weighted average of 22.5%. Similarly, the statistical analysis conducted on geographies consisting of 197,939,281 people shows a weak positive correlation between the proportion of Immigrants from Malaysia and wage/income gap percentage in the United States with a correlation coefficient (R) of 0.207 and weighted average of 26.3%, a difference of 16.6%.
Wage/Income Gap Correlation Summary
| Measurement | Spanish American Indian | Immigrants from Malaysia |
| Minimum | 11.9% | 3.1% |
| Maximum | 37.9% | 68.0% |
| Range | 26.0% | 64.9% |
| Mean | 24.1% | 27.5% |
| Median | 24.3% | 26.6% |
| Interquartile 25% (IQ1) | 19.9% | 21.5% |
| Interquartile 75% (IQ3) | 28.6% | 32.4% |
| Interquartile Range (IQR) | 8.8% | 10.9% |
| Standard Deviation (Sample) | 6.0% | 12.3% |
| Standard Deviation (Population) | 5.9% | 12.2% |
Similar Demographics by Wage/Income Gap
Demographics Similar to Spanish American Indians by Wage/Income Gap
In terms of wage/income gap, the demographic groups most similar to Spanish American Indians are Immigrants from Ecuador (22.5%, a difference of 0.29%), Guatemalan (22.6%, a difference of 0.32%), Immigrants from Guatemala (22.5%, a difference of 0.43%), Central American Indian (22.7%, a difference of 0.56%), and Immigrants from Fiji (22.4%, a difference of 0.64%).
| Demographics | Rating | Rank | Wage/Income Gap |
| Ghanaians | 100.0 /100 | #57 | Exceptional 22.3% |
| Immigrants | Cuba | 100.0 /100 | #58 | Exceptional 22.4% |
| Navajo | 100.0 /100 | #59 | Exceptional 22.4% |
| Immigrants | Middle Africa | 100.0 /100 | #60 | Exceptional 22.4% |
| Immigrants | Fiji | 100.0 /100 | #61 | Exceptional 22.4% |
| Immigrants | Guatemala | 100.0 /100 | #62 | Exceptional 22.5% |
| Immigrants | Ecuador | 100.0 /100 | #63 | Exceptional 22.5% |
| Spanish American Indians | 100.0 /100 | #64 | Exceptional 22.5% |
| Guatemalans | 99.9 /100 | #65 | Exceptional 22.6% |
| Central American Indians | 99.9 /100 | #66 | Exceptional 22.7% |
| Menominee | 99.9 /100 | #67 | Exceptional 22.7% |
| Immigrants | Nigeria | 99.9 /100 | #68 | Exceptional 22.7% |
| Indonesians | 99.9 /100 | #69 | Exceptional 22.7% |
| Immigrants | Uzbekistan | 99.9 /100 | #70 | Exceptional 22.7% |
| Immigrants | El Salvador | 99.9 /100 | #71 | Exceptional 22.8% |
Demographics Similar to Immigrants from Malaysia by Wage/Income Gap
In terms of wage/income gap, the demographic groups most similar to Immigrants from Malaysia are Chilean (26.3%, a difference of 0.010%), Immigrants from Jordan (26.3%, a difference of 0.020%), Immigrants from Bulgaria (26.3%, a difference of 0.030%), Immigrants from Western Asia (26.3%, a difference of 0.050%), and Zimbabwean (26.3%, a difference of 0.060%).
| Demographics | Rating | Rank | Wage/Income Gap |
| Immigrants | Egypt | 29.9 /100 | #188 | Fair 26.1% |
| Immigrants | Moldova | 26.6 /100 | #189 | Fair 26.2% |
| Immigrants | Croatia | 24.8 /100 | #190 | Fair 26.2% |
| Immigrants | Venezuela | 24.7 /100 | #191 | Fair 26.2% |
| Immigrants | Bulgaria | 22.5 /100 | #192 | Fair 26.3% |
| Immigrants | Jordan | 22.4 /100 | #193 | Fair 26.3% |
| Chileans | 22.3 /100 | #194 | Fair 26.3% |
| Immigrants | Malaysia | 22.2 /100 | #195 | Fair 26.3% |
| Immigrants | Western Asia | 21.7 /100 | #196 | Fair 26.3% |
| Zimbabweans | 21.6 /100 | #197 | Fair 26.3% |
| Venezuelans | 21.5 /100 | #198 | Fair 26.3% |
| Dutch West Indians | 21.0 /100 | #199 | Fair 26.3% |
| Delaware | 20.9 /100 | #200 | Fair 26.3% |
| Immigrants | Syria | 19.3 /100 | #201 | Poor 26.4% |
| Laotians | 19.2 /100 | #202 | Poor 26.4% |