Spanish American Indian vs Thai Wage/Income Gap
COMPARE
Spanish American Indian
Thai
Wage/Income Gap
Wage/Income Gap Comparison
Spanish American Indians
Thais
22.5%
WAGE/INCOME GAP
100.0/ 100
METRIC RATING
64th/ 347
METRIC RANK
30.5%
WAGE/INCOME GAP
0.0/ 100
METRIC RATING
341st/ 347
METRIC RANK
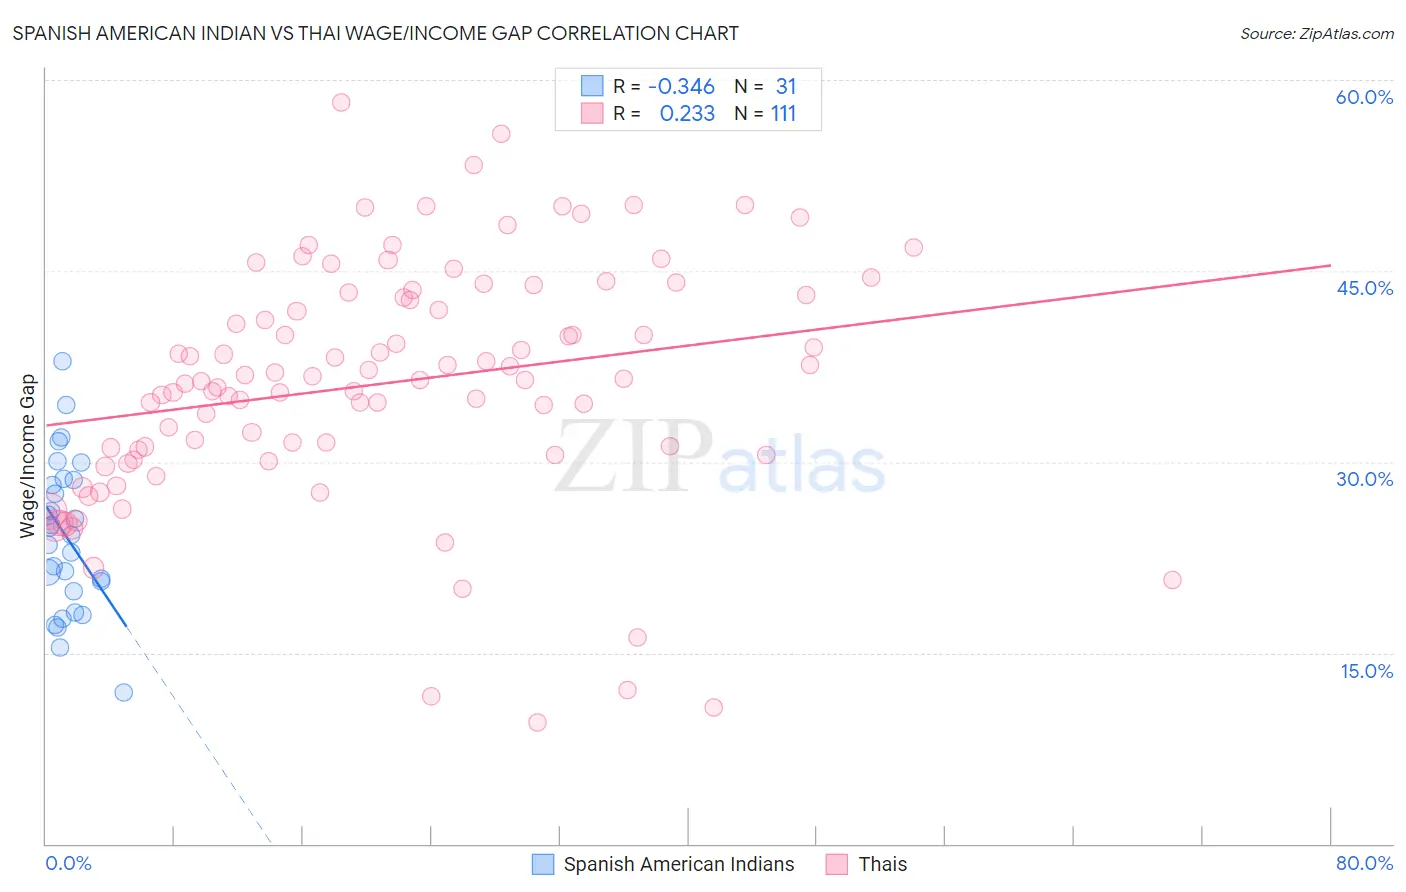
Spanish American Indian vs Thai Wage/Income Gap Correlation Chart
The statistical analysis conducted on geographies consisting of 73,143,386 people shows a mild negative correlation between the proportion of Spanish American Indians and wage/income gap percentage in the United States with a correlation coefficient (R) of -0.346 and weighted average of 22.5%. Similarly, the statistical analysis conducted on geographies consisting of 475,429,891 people shows a weak positive correlation between the proportion of Thais and wage/income gap percentage in the United States with a correlation coefficient (R) of 0.233 and weighted average of 30.5%, a difference of 35.1%.
Wage/Income Gap Correlation Summary
| Measurement | Spanish American Indian | Thai |
| Minimum | 11.9% | 9.5% |
| Maximum | 37.9% | 58.3% |
| Range | 26.0% | 48.7% |
| Mean | 24.1% | 36.2% |
| Median | 24.3% | 36.4% |
| Interquartile 25% (IQ1) | 19.9% | 30.5% |
| Interquartile 75% (IQ3) | 28.6% | 43.1% |
| Interquartile Range (IQR) | 8.8% | 12.6% |
| Standard Deviation (Sample) | 6.0% | 9.4% |
| Standard Deviation (Population) | 5.9% | 9.4% |
Similar Demographics by Wage/Income Gap
Demographics Similar to Spanish American Indians by Wage/Income Gap
In terms of wage/income gap, the demographic groups most similar to Spanish American Indians are Immigrants from Ecuador (22.5%, a difference of 0.29%), Guatemalan (22.6%, a difference of 0.32%), Immigrants from Guatemala (22.5%, a difference of 0.43%), Central American Indian (22.7%, a difference of 0.56%), and Immigrants from Fiji (22.4%, a difference of 0.64%).
| Demographics | Rating | Rank | Wage/Income Gap |
| Ghanaians | 100.0 /100 | #57 | Exceptional 22.3% |
| Immigrants | Cuba | 100.0 /100 | #58 | Exceptional 22.4% |
| Navajo | 100.0 /100 | #59 | Exceptional 22.4% |
| Immigrants | Middle Africa | 100.0 /100 | #60 | Exceptional 22.4% |
| Immigrants | Fiji | 100.0 /100 | #61 | Exceptional 22.4% |
| Immigrants | Guatemala | 100.0 /100 | #62 | Exceptional 22.5% |
| Immigrants | Ecuador | 100.0 /100 | #63 | Exceptional 22.5% |
| Spanish American Indians | 100.0 /100 | #64 | Exceptional 22.5% |
| Guatemalans | 99.9 /100 | #65 | Exceptional 22.6% |
| Central American Indians | 99.9 /100 | #66 | Exceptional 22.7% |
| Menominee | 99.9 /100 | #67 | Exceptional 22.7% |
| Immigrants | Nigeria | 99.9 /100 | #68 | Exceptional 22.7% |
| Indonesians | 99.9 /100 | #69 | Exceptional 22.7% |
| Immigrants | Uzbekistan | 99.9 /100 | #70 | Exceptional 22.7% |
| Immigrants | El Salvador | 99.9 /100 | #71 | Exceptional 22.8% |
Demographics Similar to Thais by Wage/Income Gap
In terms of wage/income gap, the demographic groups most similar to Thais are Pennsylvania German (30.7%, a difference of 0.77%), Danish (31.0%, a difference of 1.6%), Swiss (30.0%, a difference of 1.7%), Assyrian/Chaldean/Syriac (31.0%, a difference of 1.8%), and Iranian (29.7%, a difference of 2.5%).
| Demographics | Rating | Rank | Wage/Income Gap |
| Europeans | 0.0 /100 | #333 | Tragic 29.4% |
| Swedes | 0.0 /100 | #334 | Tragic 29.4% |
| Immigrants | Taiwan | 0.0 /100 | #335 | Tragic 29.5% |
| English | 0.0 /100 | #336 | Tragic 29.5% |
| Dutch | 0.0 /100 | #337 | Tragic 29.6% |
| Filipinos | 0.0 /100 | #338 | Tragic 29.7% |
| Iranians | 0.0 /100 | #339 | Tragic 29.7% |
| Swiss | 0.0 /100 | #340 | Tragic 30.0% |
| Thais | 0.0 /100 | #341 | Tragic 30.5% |
| Pennsylvania Germans | 0.0 /100 | #342 | Tragic 30.7% |
| Danes | 0.0 /100 | #343 | Tragic 31.0% |
| Assyrians/Chaldeans/Syriacs | 0.0 /100 | #344 | Tragic 31.0% |
| Immigrants | India | 0.0 /100 | #345 | Tragic 31.5% |
| Cajuns | 0.0 /100 | #346 | Tragic 33.9% |
| Houma | 0.0 /100 | #347 | Tragic 38.7% |