Immigrants from Singapore vs Immigrants from Malaysia Wage/Income Gap
COMPARE
Immigrants from Singapore
Immigrants from Malaysia
Wage/Income Gap
Wage/Income Gap Comparison
Immigrants from Singapore
Immigrants from Malaysia
28.9%
WAGE/INCOME GAP
0.1/ 100
METRIC RATING
322nd/ 347
METRIC RANK
26.3%
WAGE/INCOME GAP
22.2/ 100
METRIC RATING
195th/ 347
METRIC RANK
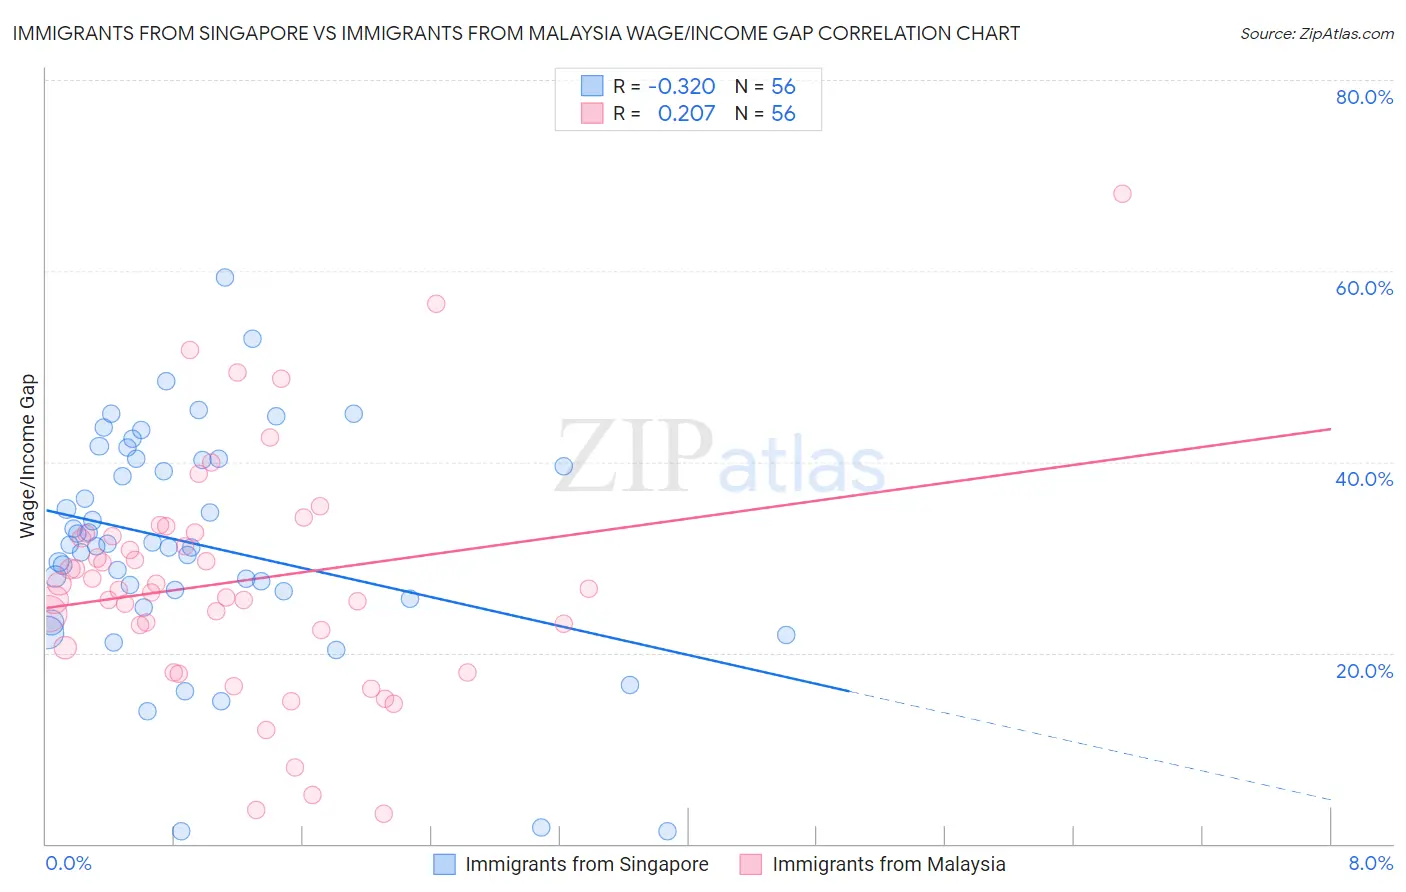
Immigrants from Singapore vs Immigrants from Malaysia Wage/Income Gap Correlation Chart
The statistical analysis conducted on geographies consisting of 137,510,142 people shows a mild negative correlation between the proportion of Immigrants from Singapore and wage/income gap percentage in the United States with a correlation coefficient (R) of -0.320 and weighted average of 28.9%. Similarly, the statistical analysis conducted on geographies consisting of 197,939,281 people shows a weak positive correlation between the proportion of Immigrants from Malaysia and wage/income gap percentage in the United States with a correlation coefficient (R) of 0.207 and weighted average of 26.3%, a difference of 10.0%.
Wage/Income Gap Correlation Summary
| Measurement | Immigrants from Singapore | Immigrants from Malaysia |
| Minimum | 1.3% | 3.1% |
| Maximum | 59.3% | 68.0% |
| Range | 58.0% | 64.9% |
| Mean | 31.3% | 27.5% |
| Median | 31.2% | 26.6% |
| Interquartile 25% (IQ1) | 26.0% | 21.5% |
| Interquartile 75% (IQ3) | 40.2% | 32.4% |
| Interquartile Range (IQR) | 14.2% | 10.9% |
| Standard Deviation (Sample) | 11.9% | 12.3% |
| Standard Deviation (Population) | 11.8% | 12.2% |
Similar Demographics by Wage/Income Gap
Demographics Similar to Immigrants from Singapore by Wage/Income Gap
In terms of wage/income gap, the demographic groups most similar to Immigrants from Singapore are Welsh (28.9%, a difference of 0.020%), British (28.9%, a difference of 0.080%), Norwegian (29.0%, a difference of 0.11%), Slovak (28.9%, a difference of 0.15%), and Croatian (29.0%, a difference of 0.23%).
| Demographics | Rating | Rank | Wage/Income Gap |
| Maltese | 0.1 /100 | #315 | Tragic 28.7% |
| Lithuanians | 0.1 /100 | #316 | Tragic 28.7% |
| Belgians | 0.1 /100 | #317 | Tragic 28.8% |
| Basques | 0.1 /100 | #318 | Tragic 28.8% |
| Slovaks | 0.1 /100 | #319 | Tragic 28.9% |
| British | 0.1 /100 | #320 | Tragic 28.9% |
| Welsh | 0.1 /100 | #321 | Tragic 28.9% |
| Immigrants | Singapore | 0.1 /100 | #322 | Tragic 28.9% |
| Norwegians | 0.1 /100 | #323 | Tragic 29.0% |
| Croatians | 0.0 /100 | #324 | Tragic 29.0% |
| Hungarians | 0.0 /100 | #325 | Tragic 29.0% |
| Immigrants | Belgium | 0.0 /100 | #326 | Tragic 29.0% |
| Immigrants | Iran | 0.0 /100 | #327 | Tragic 29.1% |
| Scandinavians | 0.0 /100 | #328 | Tragic 29.1% |
| Scottish | 0.0 /100 | #329 | Tragic 29.1% |
Demographics Similar to Immigrants from Malaysia by Wage/Income Gap
In terms of wage/income gap, the demographic groups most similar to Immigrants from Malaysia are Chilean (26.3%, a difference of 0.010%), Immigrants from Jordan (26.3%, a difference of 0.020%), Immigrants from Bulgaria (26.3%, a difference of 0.030%), Immigrants from Western Asia (26.3%, a difference of 0.050%), and Zimbabwean (26.3%, a difference of 0.060%).
| Demographics | Rating | Rank | Wage/Income Gap |
| Immigrants | Egypt | 29.9 /100 | #188 | Fair 26.1% |
| Immigrants | Moldova | 26.6 /100 | #189 | Fair 26.2% |
| Immigrants | Croatia | 24.8 /100 | #190 | Fair 26.2% |
| Immigrants | Venezuela | 24.7 /100 | #191 | Fair 26.2% |
| Immigrants | Bulgaria | 22.5 /100 | #192 | Fair 26.3% |
| Immigrants | Jordan | 22.4 /100 | #193 | Fair 26.3% |
| Chileans | 22.3 /100 | #194 | Fair 26.3% |
| Immigrants | Malaysia | 22.2 /100 | #195 | Fair 26.3% |
| Immigrants | Western Asia | 21.7 /100 | #196 | Fair 26.3% |
| Zimbabweans | 21.6 /100 | #197 | Fair 26.3% |
| Venezuelans | 21.5 /100 | #198 | Fair 26.3% |
| Dutch West Indians | 21.0 /100 | #199 | Fair 26.3% |
| Delaware | 20.9 /100 | #200 | Fair 26.3% |
| Immigrants | Syria | 19.3 /100 | #201 | Poor 26.4% |
| Laotians | 19.2 /100 | #202 | Poor 26.4% |