Arapaho vs Lebanese Median Female Earnings
COMPARE
Arapaho
Lebanese
Median Female Earnings
Median Female Earnings Comparison
Arapaho
Lebanese
$31,489
MEDIAN FEMALE EARNINGS
0.0/ 100
METRIC RATING
346th/ 347
METRIC RANK
$40,006
MEDIAN FEMALE EARNINGS
65.5/ 100
METRIC RATING
163rd/ 347
METRIC RANK
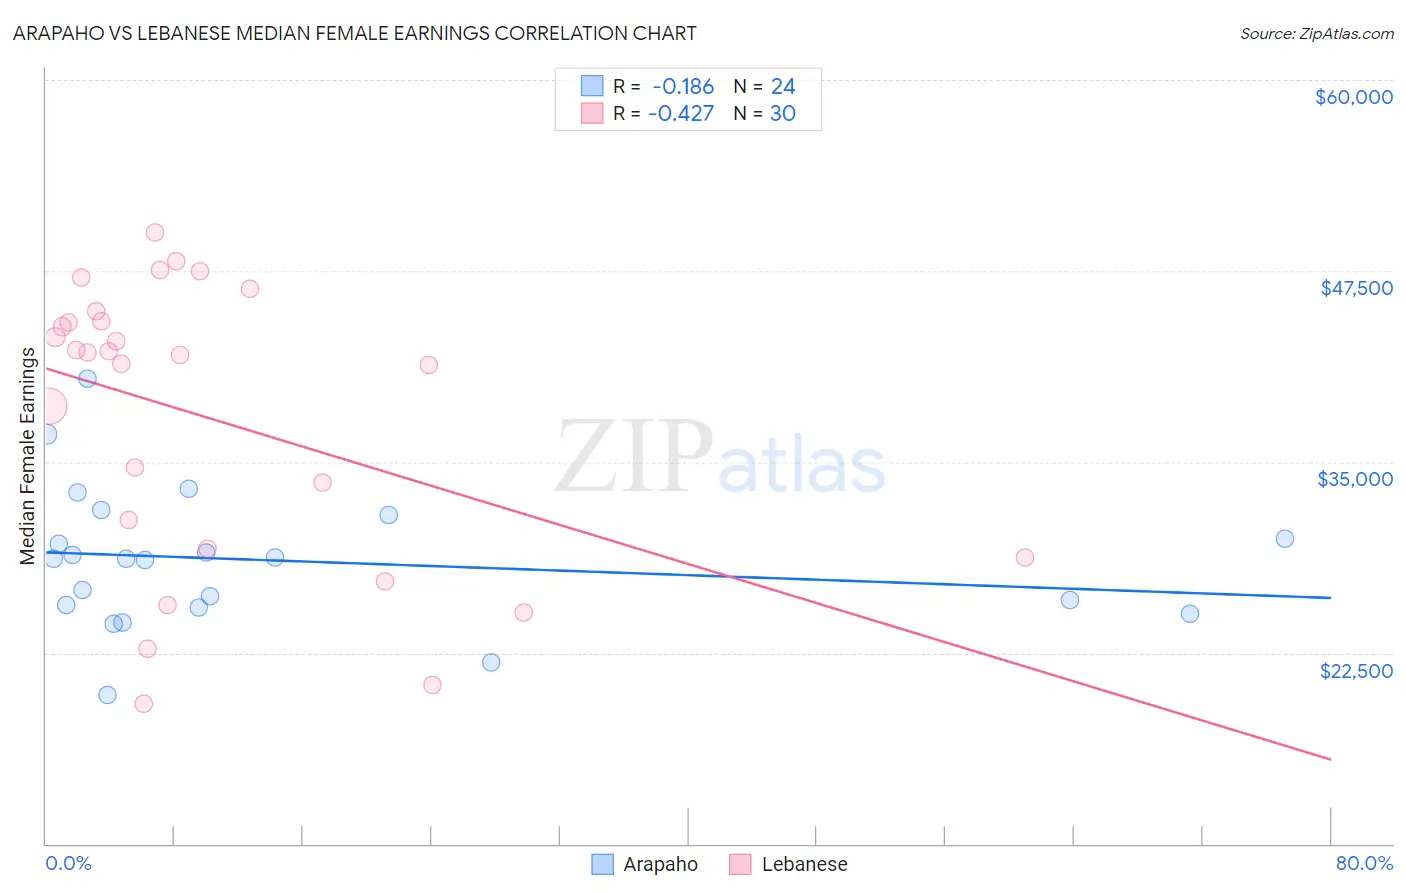
Arapaho vs Lebanese Median Female Earnings Correlation Chart
The statistical analysis conducted on geographies consisting of 29,776,290 people shows a poor negative correlation between the proportion of Arapaho and median female earnings in the United States with a correlation coefficient (R) of -0.186 and weighted average of $31,489. Similarly, the statistical analysis conducted on geographies consisting of 401,457,722 people shows a moderate negative correlation between the proportion of Lebanese and median female earnings in the United States with a correlation coefficient (R) of -0.427 and weighted average of $40,006, a difference of 27.1%.
Median Female Earnings Correlation Summary
| Measurement | Arapaho | Lebanese |
| Minimum | $19,750 | $19,128 |
| Maximum | $40,452 | $50,050 |
| Range | $20,702 | $30,922 |
| Mean | $28,528 | $37,921 |
| Median | $28,660 | $42,088 |
| Interquartile 25% (IQ1) | $25,558 | $29,289 |
| Interquartile 75% (IQ3) | $30,782 | $44,167 |
| Interquartile Range (IQR) | $5,224 | $14,878 |
| Standard Deviation (Sample) | $4,555 | $9,199 |
| Standard Deviation (Population) | $4,459 | $9,044 |
Similar Demographics by Median Female Earnings
Demographics Similar to Arapaho by Median Female Earnings
In terms of median female earnings, the demographic groups most similar to Arapaho are Puerto Rican ($31,560, a difference of 0.23%), Lumbee ($32,500, a difference of 3.2%), Pueblo ($32,564, a difference of 3.4%), Houma ($30,343, a difference of 3.8%), and Yup'ik ($32,730, a difference of 3.9%).
| Demographics | Rating | Rank | Median Female Earnings |
| Mexicans | 0.0 /100 | #333 | Tragic $33,664 |
| Spanish American Indians | 0.0 /100 | #334 | Tragic $33,625 |
| Creek | 0.0 /100 | #335 | Tragic $33,437 |
| Ottawa | 0.0 /100 | #336 | Tragic $33,378 |
| Yakama | 0.0 /100 | #337 | Tragic $33,354 |
| Immigrants | Cuba | 0.0 /100 | #338 | Tragic $33,291 |
| Immigrants | Mexico | 0.0 /100 | #339 | Tragic $33,236 |
| Tohono O'odham | 0.0 /100 | #340 | Tragic $33,205 |
| Navajo | 0.0 /100 | #341 | Tragic $33,046 |
| Yup'ik | 0.0 /100 | #342 | Tragic $32,730 |
| Pueblo | 0.0 /100 | #343 | Tragic $32,564 |
| Lumbee | 0.0 /100 | #344 | Tragic $32,500 |
| Puerto Ricans | 0.0 /100 | #345 | Tragic $31,560 |
| Arapaho | 0.0 /100 | #346 | Tragic $31,489 |
| Houma | 0.0 /100 | #347 | Tragic $30,343 |
Demographics Similar to Lebanese by Median Female Earnings
In terms of median female earnings, the demographic groups most similar to Lebanese are South American Indian ($40,019, a difference of 0.030%), Alsatian ($40,060, a difference of 0.14%), Immigrants from Saudi Arabia ($39,952, a difference of 0.14%), Inupiat ($40,080, a difference of 0.18%), and Immigrants from Bangladesh ($39,910, a difference of 0.24%).
| Demographics | Rating | Rank | Median Female Earnings |
| Peruvians | 75.3 /100 | #156 | Good $40,234 |
| Portuguese | 73.0 /100 | #157 | Good $40,177 |
| Immigrants | Senegal | 72.2 /100 | #158 | Good $40,157 |
| Immigrants | Vietnam | 72.0 /100 | #159 | Good $40,153 |
| Inupiat | 68.9 /100 | #160 | Good $40,080 |
| Alsatians | 68.0 /100 | #161 | Good $40,060 |
| South American Indians | 66.1 /100 | #162 | Good $40,019 |
| Lebanese | 65.5 /100 | #163 | Good $40,006 |
| Immigrants | Saudi Arabia | 62.9 /100 | #164 | Good $39,952 |
| Immigrants | Bangladesh | 60.8 /100 | #165 | Good $39,910 |
| Immigrants | Ghana | 60.0 /100 | #166 | Good $39,894 |
| Luxembourgers | 59.9 /100 | #167 | Average $39,891 |
| Immigrants | Peru | 58.9 /100 | #168 | Average $39,871 |
| Kenyans | 58.4 /100 | #169 | Average $39,860 |
| Slovenes | 56.2 /100 | #170 | Average $39,817 |