Indonesian vs Lebanese Median Female Earnings
COMPARE
Indonesian
Lebanese
Median Female Earnings
Median Female Earnings Comparison
Indonesians
Lebanese
$36,140
MEDIAN FEMALE EARNINGS
0.1/ 100
METRIC RATING
284th/ 347
METRIC RANK
$40,006
MEDIAN FEMALE EARNINGS
65.5/ 100
METRIC RATING
163rd/ 347
METRIC RANK
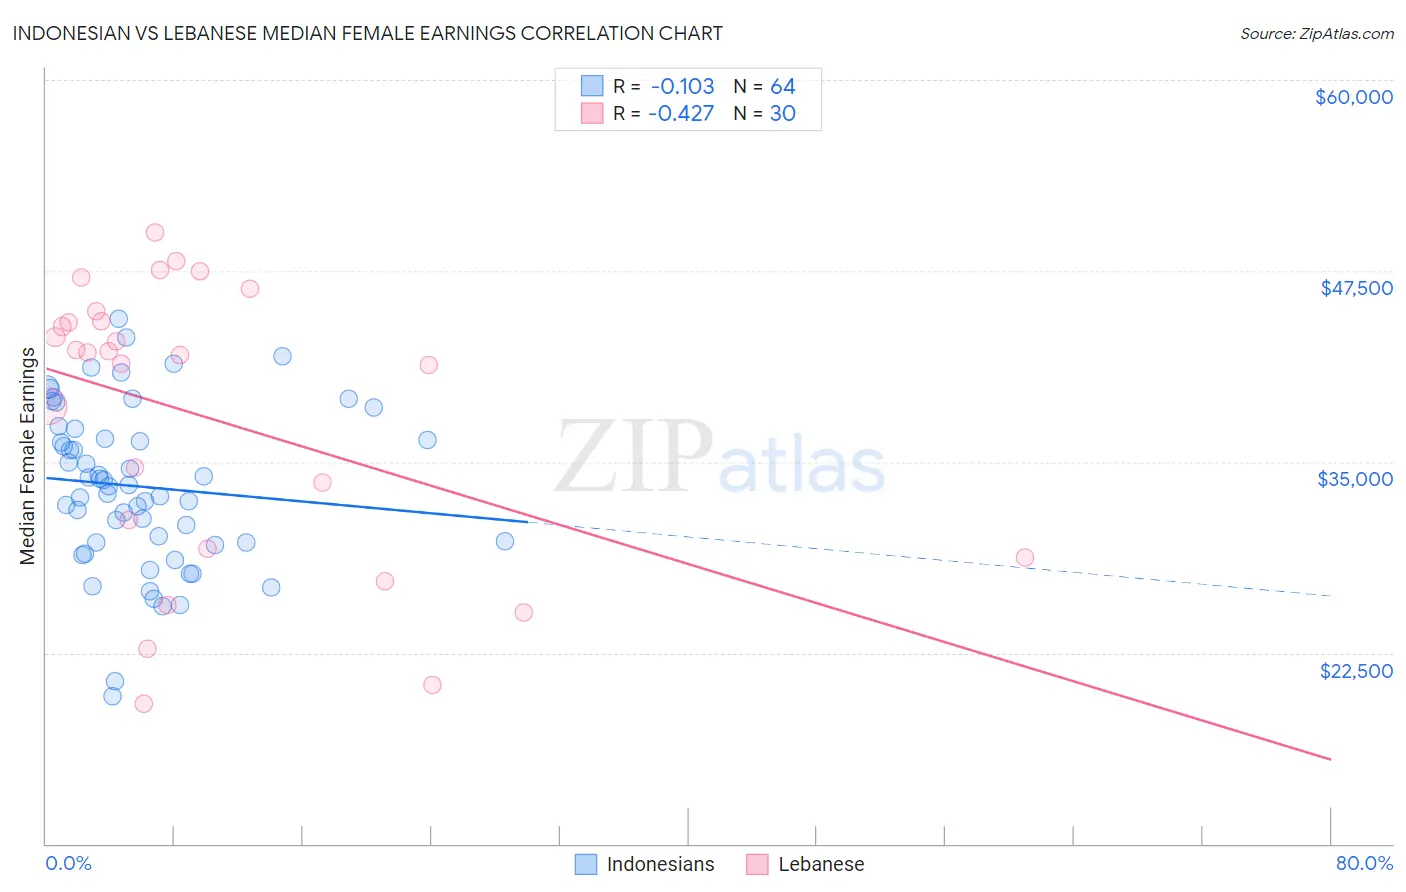
Indonesian vs Lebanese Median Female Earnings Correlation Chart
The statistical analysis conducted on geographies consisting of 162,730,900 people shows a poor negative correlation between the proportion of Indonesians and median female earnings in the United States with a correlation coefficient (R) of -0.103 and weighted average of $36,140. Similarly, the statistical analysis conducted on geographies consisting of 401,457,722 people shows a moderate negative correlation between the proportion of Lebanese and median female earnings in the United States with a correlation coefficient (R) of -0.427 and weighted average of $40,006, a difference of 10.7%.
Median Female Earnings Correlation Summary
| Measurement | Indonesian | Lebanese |
| Minimum | $19,686 | $19,128 |
| Maximum | $44,373 | $50,050 |
| Range | $24,687 | $30,922 |
| Mean | $33,375 | $37,921 |
| Median | $33,447 | $42,088 |
| Interquartile 25% (IQ1) | $29,712 | $29,289 |
| Interquartile 75% (IQ3) | $36,850 | $44,167 |
| Interquartile Range (IQR) | $7,138 | $14,878 |
| Standard Deviation (Sample) | $5,258 | $9,199 |
| Standard Deviation (Population) | $5,217 | $9,044 |
Similar Demographics by Median Female Earnings
Demographics Similar to Indonesians by Median Female Earnings
In terms of median female earnings, the demographic groups most similar to Indonesians are Immigrants from Haiti ($36,203, a difference of 0.17%), Paiute ($36,056, a difference of 0.23%), Osage ($36,034, a difference of 0.29%), Immigrants from Nicaragua ($36,023, a difference of 0.33%), and Immigrants from Zaire ($36,017, a difference of 0.34%).
| Demographics | Rating | Rank | Median Female Earnings |
| Marshallese | 0.1 /100 | #277 | Tragic $36,459 |
| U.S. Virgin Islanders | 0.1 /100 | #278 | Tragic $36,424 |
| Immigrants | Caribbean | 0.1 /100 | #279 | Tragic $36,414 |
| Iroquois | 0.1 /100 | #280 | Tragic $36,408 |
| Spanish Americans | 0.1 /100 | #281 | Tragic $36,391 |
| Haitians | 0.1 /100 | #282 | Tragic $36,374 |
| Immigrants | Haiti | 0.1 /100 | #283 | Tragic $36,203 |
| Indonesians | 0.1 /100 | #284 | Tragic $36,140 |
| Paiute | 0.1 /100 | #285 | Tragic $36,056 |
| Osage | 0.0 /100 | #286 | Tragic $36,034 |
| Immigrants | Nicaragua | 0.0 /100 | #287 | Tragic $36,023 |
| Immigrants | Zaire | 0.0 /100 | #288 | Tragic $36,017 |
| Bangladeshis | 0.0 /100 | #289 | Tragic $35,960 |
| Central American Indians | 0.0 /100 | #290 | Tragic $35,930 |
| Blackfeet | 0.0 /100 | #291 | Tragic $35,864 |
Demographics Similar to Lebanese by Median Female Earnings
In terms of median female earnings, the demographic groups most similar to Lebanese are South American Indian ($40,019, a difference of 0.030%), Alsatian ($40,060, a difference of 0.14%), Immigrants from Saudi Arabia ($39,952, a difference of 0.14%), Inupiat ($40,080, a difference of 0.18%), and Immigrants from Bangladesh ($39,910, a difference of 0.24%).
| Demographics | Rating | Rank | Median Female Earnings |
| Peruvians | 75.3 /100 | #156 | Good $40,234 |
| Portuguese | 73.0 /100 | #157 | Good $40,177 |
| Immigrants | Senegal | 72.2 /100 | #158 | Good $40,157 |
| Immigrants | Vietnam | 72.0 /100 | #159 | Good $40,153 |
| Inupiat | 68.9 /100 | #160 | Good $40,080 |
| Alsatians | 68.0 /100 | #161 | Good $40,060 |
| South American Indians | 66.1 /100 | #162 | Good $40,019 |
| Lebanese | 65.5 /100 | #163 | Good $40,006 |
| Immigrants | Saudi Arabia | 62.9 /100 | #164 | Good $39,952 |
| Immigrants | Bangladesh | 60.8 /100 | #165 | Good $39,910 |
| Immigrants | Ghana | 60.0 /100 | #166 | Good $39,894 |
| Luxembourgers | 59.9 /100 | #167 | Average $39,891 |
| Immigrants | Peru | 58.9 /100 | #168 | Average $39,871 |
| Kenyans | 58.4 /100 | #169 | Average $39,860 |
| Slovenes | 56.2 /100 | #170 | Average $39,817 |