Immigrants from Canada vs Immigrants from North America Median Female Earnings
COMPARE
Immigrants from Canada
Immigrants from North America
Median Female Earnings
Median Female Earnings Comparison
Immigrants from Canada
Immigrants from North America
$41,373
MEDIAN FEMALE EARNINGS
97.0/ 100
METRIC RATING
111th/ 347
METRIC RANK
$41,319
MEDIAN FEMALE EARNINGS
96.7/ 100
METRIC RATING
112th/ 347
METRIC RANK
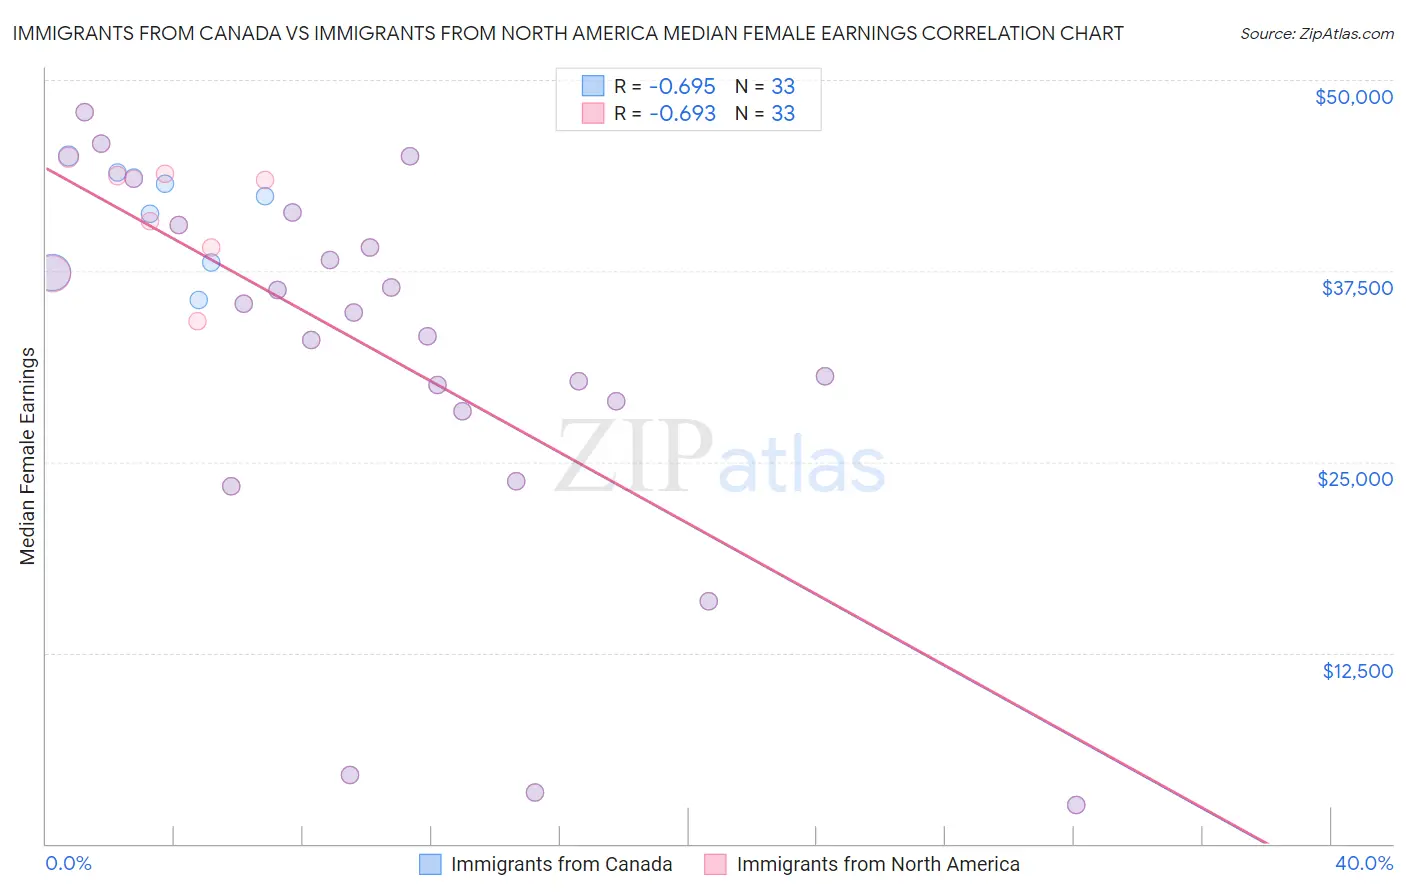
Immigrants from Canada vs Immigrants from North America Median Female Earnings Correlation Chart
The statistical analysis conducted on geographies consisting of 459,023,648 people shows a significant negative correlation between the proportion of Immigrants from Canada and median female earnings in the United States with a correlation coefficient (R) of -0.695 and weighted average of $41,373. Similarly, the statistical analysis conducted on geographies consisting of 462,086,595 people shows a significant negative correlation between the proportion of Immigrants from North America and median female earnings in the United States with a correlation coefficient (R) of -0.693 and weighted average of $41,319, a difference of 0.13%.
Median Female Earnings Correlation Summary
| Measurement | Immigrants from Canada | Immigrants from North America |
| Minimum | $2,499 | $2,499 |
| Maximum | $47,885 | $47,877 |
| Range | $45,386 | $45,378 |
| Mean | $33,293 | $33,312 |
| Median | $36,283 | $36,283 |
| Interquartile 25% (IQ1) | $29,495 | $29,495 |
| Interquartile 75% (IQ3) | $41,844 | $42,384 |
| Interquartile Range (IQR) | $12,349 | $12,888 |
| Standard Deviation (Sample) | $11,971 | $12,008 |
| Standard Deviation (Population) | $11,788 | $11,825 |
Demographics Similar to Immigrants from Canada and Immigrants from North America by Median Female Earnings
In terms of median female earnings, the demographic groups most similar to Immigrants from Canada are Immigrants from Western Asia ($41,375, a difference of 0.010%), Chinese ($41,461, a difference of 0.21%), Macedonian ($41,286, a difference of 0.21%), Jordanian ($41,464, a difference of 0.22%), and Immigrants from England ($41,277, a difference of 0.23%). Similarly, the demographic groups most similar to Immigrants from North America are Macedonian ($41,286, a difference of 0.080%), Immigrants from England ($41,277, a difference of 0.10%), Korean ($41,276, a difference of 0.10%), Immigrants from Brazil ($41,273, a difference of 0.11%), and Immigrants from Western Asia ($41,375, a difference of 0.14%).
| Demographics | Rating | Rank | Median Female Earnings |
| Immigrants | Fiji | 98.3 /100 | #101 | Exceptional $41,656 |
| Immigrants | Poland | 98.2 /100 | #102 | Exceptional $41,630 |
| Immigrants | Argentina | 97.9 /100 | #103 | Exceptional $41,554 |
| Immigrants | Zimbabwe | 97.8 /100 | #104 | Exceptional $41,527 |
| Italians | 97.7 /100 | #105 | Exceptional $41,505 |
| Immigrants | Eritrea | 97.6 /100 | #106 | Exceptional $41,485 |
| Palestinians | 97.6 /100 | #107 | Exceptional $41,484 |
| Jordanians | 97.5 /100 | #108 | Exceptional $41,464 |
| Chinese | 97.5 /100 | #109 | Exceptional $41,461 |
| Immigrants | Western Asia | 97.0 /100 | #110 | Exceptional $41,375 |
| Immigrants | Canada | 97.0 /100 | #111 | Exceptional $41,373 |
| Immigrants | North America | 96.7 /100 | #112 | Exceptional $41,319 |
| Macedonians | 96.4 /100 | #113 | Exceptional $41,286 |
| Immigrants | England | 96.4 /100 | #114 | Exceptional $41,277 |
| Koreans | 96.4 /100 | #115 | Exceptional $41,276 |
| Immigrants | Brazil | 96.4 /100 | #116 | Exceptional $41,273 |
| Barbadians | 96.3 /100 | #117 | Exceptional $41,261 |
| Immigrants | Lebanon | 95.6 /100 | #118 | Exceptional $41,183 |
| Immigrants | Philippines | 95.0 /100 | #119 | Exceptional $41,114 |
| Immigrants | Kuwait | 94.4 /100 | #120 | Exceptional $41,055 |
| Croatians | 93.7 /100 | #121 | Exceptional $40,993 |