Hispanic or Latino vs Immigrants from North America Median Female Earnings
COMPARE
Hispanic or Latino
Immigrants from North America
Median Female Earnings
Median Female Earnings Comparison
Hispanics or Latinos
Immigrants from North America
$34,421
MEDIAN FEMALE EARNINGS
0.0/ 100
METRIC RATING
321st/ 347
METRIC RANK
$41,319
MEDIAN FEMALE EARNINGS
96.7/ 100
METRIC RATING
112th/ 347
METRIC RANK
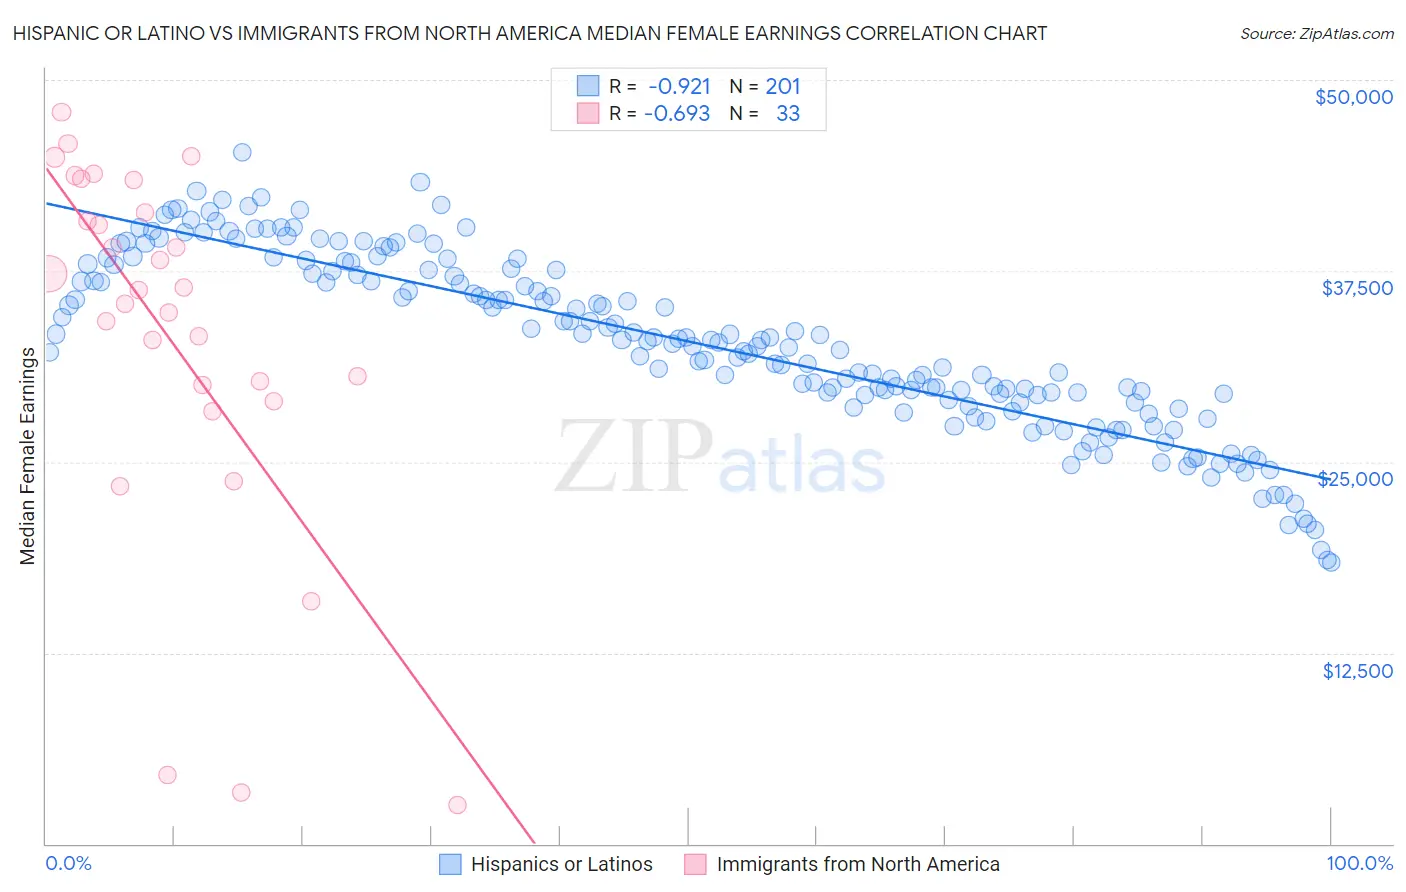
Hispanic or Latino vs Immigrants from North America Median Female Earnings Correlation Chart
The statistical analysis conducted on geographies consisting of 576,408,721 people shows a near-perfect negative correlation between the proportion of Hispanics or Latinos and median female earnings in the United States with a correlation coefficient (R) of -0.921 and weighted average of $34,421. Similarly, the statistical analysis conducted on geographies consisting of 462,086,595 people shows a significant negative correlation between the proportion of Immigrants from North America and median female earnings in the United States with a correlation coefficient (R) of -0.693 and weighted average of $41,319, a difference of 20.0%.
Median Female Earnings Correlation Summary
| Measurement | Hispanic or Latino | Immigrants from North America |
| Minimum | $18,390 | $2,499 |
| Maximum | $45,279 | $47,877 |
| Range | $26,890 | $45,378 |
| Mean | $32,838 | $33,312 |
| Median | $32,964 | $36,283 |
| Interquartile 25% (IQ1) | $29,181 | $29,495 |
| Interquartile 75% (IQ3) | $37,606 | $42,384 |
| Interquartile Range (IQR) | $8,426 | $12,888 |
| Standard Deviation (Sample) | $5,710 | $12,008 |
| Standard Deviation (Population) | $5,696 | $11,825 |
Similar Demographics by Median Female Earnings
Demographics Similar to Hispanics or Latinos by Median Female Earnings
In terms of median female earnings, the demographic groups most similar to Hispanics or Latinos are Chickasaw ($34,414, a difference of 0.020%), Seminole ($34,385, a difference of 0.11%), Immigrants from Congo ($34,317, a difference of 0.31%), Immigrants from Honduras ($34,647, a difference of 0.66%), and Shoshone ($34,677, a difference of 0.74%).
| Demographics | Rating | Rank | Median Female Earnings |
| Apache | 0.0 /100 | #314 | Tragic $34,895 |
| Pennsylvania Germans | 0.0 /100 | #315 | Tragic $34,802 |
| Cherokee | 0.0 /100 | #316 | Tragic $34,742 |
| Potawatomi | 0.0 /100 | #317 | Tragic $34,739 |
| Immigrants | Yemen | 0.0 /100 | #318 | Tragic $34,693 |
| Shoshone | 0.0 /100 | #319 | Tragic $34,677 |
| Immigrants | Honduras | 0.0 /100 | #320 | Tragic $34,647 |
| Hispanics or Latinos | 0.0 /100 | #321 | Tragic $34,421 |
| Chickasaw | 0.0 /100 | #322 | Tragic $34,414 |
| Seminole | 0.0 /100 | #323 | Tragic $34,385 |
| Immigrants | Congo | 0.0 /100 | #324 | Tragic $34,317 |
| Dutch West Indians | 0.0 /100 | #325 | Tragic $34,106 |
| Kiowa | 0.0 /100 | #326 | Tragic $34,074 |
| Cajuns | 0.0 /100 | #327 | Tragic $34,034 |
| Immigrants | Central America | 0.0 /100 | #328 | Tragic $33,953 |
Demographics Similar to Immigrants from North America by Median Female Earnings
In terms of median female earnings, the demographic groups most similar to Immigrants from North America are Macedonian ($41,286, a difference of 0.080%), Immigrants from England ($41,277, a difference of 0.10%), Korean ($41,276, a difference of 0.10%), Immigrants from Brazil ($41,273, a difference of 0.11%), and Immigrants from Canada ($41,373, a difference of 0.13%).
| Demographics | Rating | Rank | Median Female Earnings |
| Italians | 97.7 /100 | #105 | Exceptional $41,505 |
| Immigrants | Eritrea | 97.6 /100 | #106 | Exceptional $41,485 |
| Palestinians | 97.6 /100 | #107 | Exceptional $41,484 |
| Jordanians | 97.5 /100 | #108 | Exceptional $41,464 |
| Chinese | 97.5 /100 | #109 | Exceptional $41,461 |
| Immigrants | Western Asia | 97.0 /100 | #110 | Exceptional $41,375 |
| Immigrants | Canada | 97.0 /100 | #111 | Exceptional $41,373 |
| Immigrants | North America | 96.7 /100 | #112 | Exceptional $41,319 |
| Macedonians | 96.4 /100 | #113 | Exceptional $41,286 |
| Immigrants | England | 96.4 /100 | #114 | Exceptional $41,277 |
| Koreans | 96.4 /100 | #115 | Exceptional $41,276 |
| Immigrants | Brazil | 96.4 /100 | #116 | Exceptional $41,273 |
| Barbadians | 96.3 /100 | #117 | Exceptional $41,261 |
| Immigrants | Lebanon | 95.6 /100 | #118 | Exceptional $41,183 |
| Immigrants | Philippines | 95.0 /100 | #119 | Exceptional $41,114 |