Panamanian vs Immigrants from North America Median Female Earnings
COMPARE
Panamanian
Immigrants from North America
Median Female Earnings
Median Female Earnings Comparison
Panamanians
Immigrants from North America
$39,049
MEDIAN FEMALE EARNINGS
20.6/ 100
METRIC RATING
201st/ 347
METRIC RANK
$41,319
MEDIAN FEMALE EARNINGS
96.7/ 100
METRIC RATING
112th/ 347
METRIC RANK
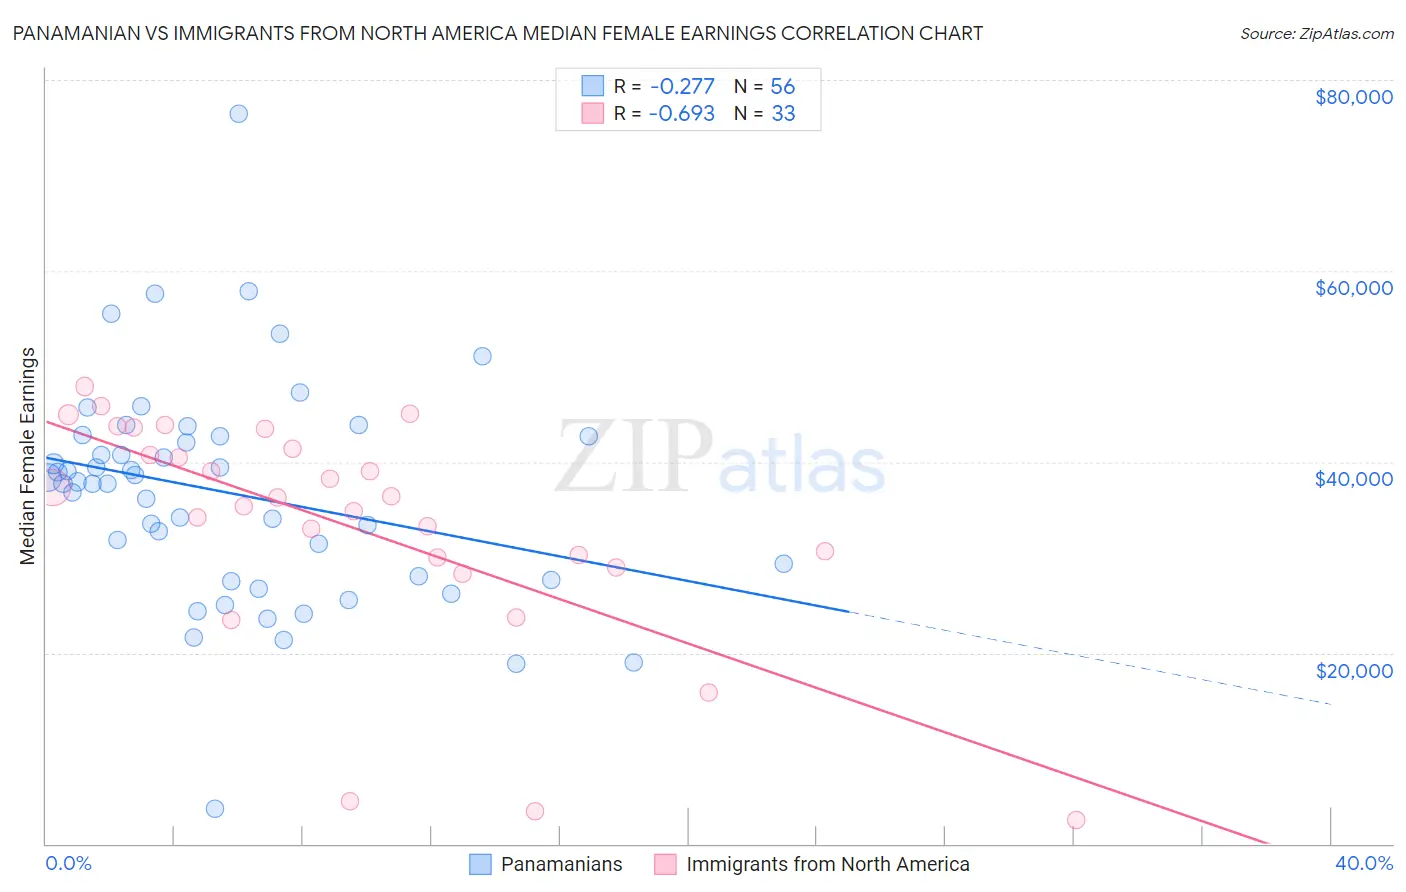
Panamanian vs Immigrants from North America Median Female Earnings Correlation Chart
The statistical analysis conducted on geographies consisting of 281,178,776 people shows a weak negative correlation between the proportion of Panamanians and median female earnings in the United States with a correlation coefficient (R) of -0.277 and weighted average of $39,049. Similarly, the statistical analysis conducted on geographies consisting of 462,086,595 people shows a significant negative correlation between the proportion of Immigrants from North America and median female earnings in the United States with a correlation coefficient (R) of -0.693 and weighted average of $41,319, a difference of 5.8%.
Median Female Earnings Correlation Summary
| Measurement | Panamanian | Immigrants from North America |
| Minimum | $3,667 | $2,499 |
| Maximum | $76,443 | $47,877 |
| Range | $72,776 | $45,378 |
| Mean | $36,686 | $33,312 |
| Median | $37,828 | $36,283 |
| Interquartile 25% (IQ1) | $27,848 | $29,495 |
| Interquartile 75% (IQ3) | $42,686 | $42,384 |
| Interquartile Range (IQR) | $14,839 | $12,888 |
| Standard Deviation (Sample) | $11,684 | $12,008 |
| Standard Deviation (Population) | $11,579 | $11,825 |
Similar Demographics by Median Female Earnings
Demographics Similar to Panamanians by Median Female Earnings
In terms of median female earnings, the demographic groups most similar to Panamanians are Immigrants from Panama ($39,049, a difference of 0.0%), Slovak ($39,029, a difference of 0.050%), Icelander ($39,109, a difference of 0.15%), Czech ($38,992, a difference of 0.15%), and Ecuadorian ($39,117, a difference of 0.17%).
| Demographics | Rating | Rank | Median Female Earnings |
| Irish | 30.0 /100 | #194 | Fair $39,291 |
| Uruguayans | 27.3 /100 | #195 | Fair $39,228 |
| Immigrants | Costa Rica | 25.6 /100 | #196 | Fair $39,186 |
| Assyrians/Chaldeans/Syriacs | 24.6 /100 | #197 | Fair $39,159 |
| Ecuadorians | 23.0 /100 | #198 | Fair $39,117 |
| Icelanders | 22.7 /100 | #199 | Fair $39,109 |
| Immigrants | Panama | 20.6 /100 | #200 | Fair $39,049 |
| Panamanians | 20.6 /100 | #201 | Fair $39,049 |
| Slovaks | 19.9 /100 | #202 | Poor $39,029 |
| Czechs | 18.7 /100 | #203 | Poor $38,992 |
| Immigrants | Uruguay | 17.3 /100 | #204 | Poor $38,945 |
| Immigrants | Colombia | 16.3 /100 | #205 | Poor $38,913 |
| Immigrants | Bosnia and Herzegovina | 15.6 /100 | #206 | Poor $38,886 |
| Immigrants | Cambodia | 14.2 /100 | #207 | Poor $38,833 |
| Immigrants | Thailand | 13.6 /100 | #208 | Poor $38,810 |
Demographics Similar to Immigrants from North America by Median Female Earnings
In terms of median female earnings, the demographic groups most similar to Immigrants from North America are Macedonian ($41,286, a difference of 0.080%), Immigrants from England ($41,277, a difference of 0.10%), Korean ($41,276, a difference of 0.10%), Immigrants from Brazil ($41,273, a difference of 0.11%), and Immigrants from Canada ($41,373, a difference of 0.13%).
| Demographics | Rating | Rank | Median Female Earnings |
| Italians | 97.7 /100 | #105 | Exceptional $41,505 |
| Immigrants | Eritrea | 97.6 /100 | #106 | Exceptional $41,485 |
| Palestinians | 97.6 /100 | #107 | Exceptional $41,484 |
| Jordanians | 97.5 /100 | #108 | Exceptional $41,464 |
| Chinese | 97.5 /100 | #109 | Exceptional $41,461 |
| Immigrants | Western Asia | 97.0 /100 | #110 | Exceptional $41,375 |
| Immigrants | Canada | 97.0 /100 | #111 | Exceptional $41,373 |
| Immigrants | North America | 96.7 /100 | #112 | Exceptional $41,319 |
| Macedonians | 96.4 /100 | #113 | Exceptional $41,286 |
| Immigrants | England | 96.4 /100 | #114 | Exceptional $41,277 |
| Koreans | 96.4 /100 | #115 | Exceptional $41,276 |
| Immigrants | Brazil | 96.4 /100 | #116 | Exceptional $41,273 |
| Barbadians | 96.3 /100 | #117 | Exceptional $41,261 |
| Immigrants | Lebanon | 95.6 /100 | #118 | Exceptional $41,183 |
| Immigrants | Philippines | 95.0 /100 | #119 | Exceptional $41,114 |