Spaniard vs Immigrants from Cabo Verde Median Household Income
COMPARE
Spaniard
Immigrants from Cabo Verde
Median Household Income
Median Household Income Comparison
Spaniards
Immigrants from Cabo Verde
$84,644
MEDIAN HOUSEHOLD INCOME
42.7/ 100
METRIC RATING
183rd/ 347
METRIC RANK
$73,515
MEDIAN HOUSEHOLD INCOME
0.1/ 100
METRIC RATING
293rd/ 347
METRIC RANK
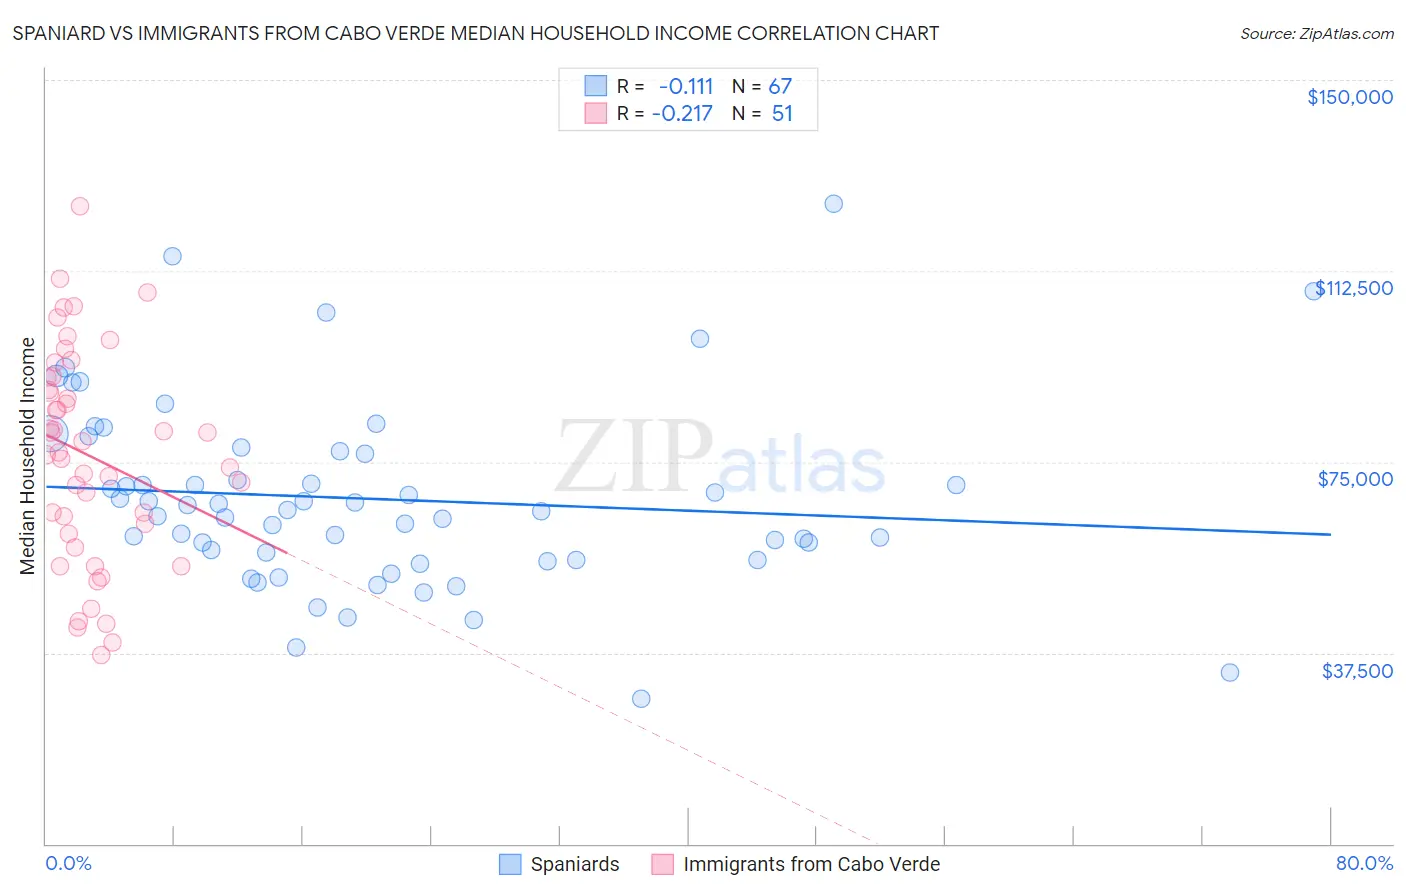
Spaniard vs Immigrants from Cabo Verde Median Household Income Correlation Chart
The statistical analysis conducted on geographies consisting of 443,014,990 people shows a poor negative correlation between the proportion of Spaniards and median household income in the United States with a correlation coefficient (R) of -0.111 and weighted average of $84,644. Similarly, the statistical analysis conducted on geographies consisting of 38,130,720 people shows a weak negative correlation between the proportion of Immigrants from Cabo Verde and median household income in the United States with a correlation coefficient (R) of -0.217 and weighted average of $73,515, a difference of 15.1%.
Median Household Income Correlation Summary
| Measurement | Spaniard | Immigrants from Cabo Verde |
| Minimum | $28,571 | $37,158 |
| Maximum | $125,625 | $125,130 |
| Range | $97,054 | $87,972 |
| Mean | $67,731 | $76,217 |
| Median | $65,475 | $76,886 |
| Interquartile 25% (IQ1) | $55,726 | $60,971 |
| Interquartile 75% (IQ3) | $77,042 | $91,527 |
| Interquartile Range (IQR) | $21,316 | $30,555 |
| Standard Deviation (Sample) | $18,232 | $20,748 |
| Standard Deviation (Population) | $18,096 | $20,544 |
Similar Demographics by Median Household Income
Demographics Similar to Spaniards by Median Household Income
In terms of median household income, the demographic groups most similar to Spaniards are Uruguayan ($84,691, a difference of 0.060%), Hawaiian ($84,729, a difference of 0.10%), Immigrants from Portugal ($84,740, a difference of 0.11%), English ($84,915, a difference of 0.32%), and Czechoslovakian ($84,965, a difference of 0.38%).
| Demographics | Rating | Rank | Median Household Income |
| Alsatians | 49.2 /100 | #176 | Average $85,053 |
| Immigrants | Eritrea | 48.8 /100 | #177 | Average $85,025 |
| Czechoslovakians | 47.8 /100 | #178 | Average $84,965 |
| English | 47.0 /100 | #179 | Average $84,915 |
| Immigrants | Portugal | 44.2 /100 | #180 | Average $84,740 |
| Hawaiians | 44.1 /100 | #181 | Average $84,729 |
| Uruguayans | 43.5 /100 | #182 | Average $84,691 |
| Spaniards | 42.7 /100 | #183 | Average $84,644 |
| Immigrants | Eastern Africa | 37.4 /100 | #184 | Fair $84,299 |
| Kenyans | 34.2 /100 | #185 | Fair $84,085 |
| Puget Sound Salish | 33.2 /100 | #186 | Fair $84,011 |
| Belgians | 33.2 /100 | #187 | Fair $84,008 |
| Tlingit-Haida | 32.6 /100 | #188 | Fair $83,968 |
| Immigrants | Colombia | 31.7 /100 | #189 | Fair $83,902 |
| Slovaks | 30.2 /100 | #190 | Fair $83,798 |
Demographics Similar to Immigrants from Cabo Verde by Median Household Income
In terms of median household income, the demographic groups most similar to Immigrants from Cabo Verde are Blackfeet ($73,509, a difference of 0.010%), Cuban ($73,392, a difference of 0.17%), Haitian ($73,306, a difference of 0.29%), Comanche ($73,747, a difference of 0.31%), and Hispanic or Latino ($73,823, a difference of 0.42%).
| Demographics | Rating | Rank | Median Household Income |
| Immigrants | Somalia | 0.1 /100 | #286 | Tragic $74,300 |
| Iroquois | 0.1 /100 | #287 | Tragic $74,279 |
| Immigrants | Central America | 0.1 /100 | #288 | Tragic $74,217 |
| Fijians | 0.1 /100 | #289 | Tragic $74,205 |
| Bangladeshis | 0.1 /100 | #290 | Tragic $74,112 |
| Hispanics or Latinos | 0.1 /100 | #291 | Tragic $73,823 |
| Comanche | 0.1 /100 | #292 | Tragic $73,747 |
| Immigrants | Cabo Verde | 0.1 /100 | #293 | Tragic $73,515 |
| Blackfeet | 0.1 /100 | #294 | Tragic $73,509 |
| Cubans | 0.1 /100 | #295 | Tragic $73,392 |
| Haitians | 0.1 /100 | #296 | Tragic $73,306 |
| Immigrants | Mexico | 0.0 /100 | #297 | Tragic $73,160 |
| Paiute | 0.0 /100 | #298 | Tragic $72,959 |
| Indonesians | 0.0 /100 | #299 | Tragic $72,856 |
| Immigrants | Dominica | 0.0 /100 | #300 | Tragic $72,760 |