Spaniard vs South American Median Household Income
COMPARE
Spaniard
South American
Median Household Income
Median Household Income Comparison
Spaniards
South Americans
$84,644
MEDIAN HOUSEHOLD INCOME
42.7/ 100
METRIC RATING
183rd/ 347
METRIC RANK
$86,824
MEDIAN HOUSEHOLD INCOME
75.1/ 100
METRIC RATING
153rd/ 347
METRIC RANK
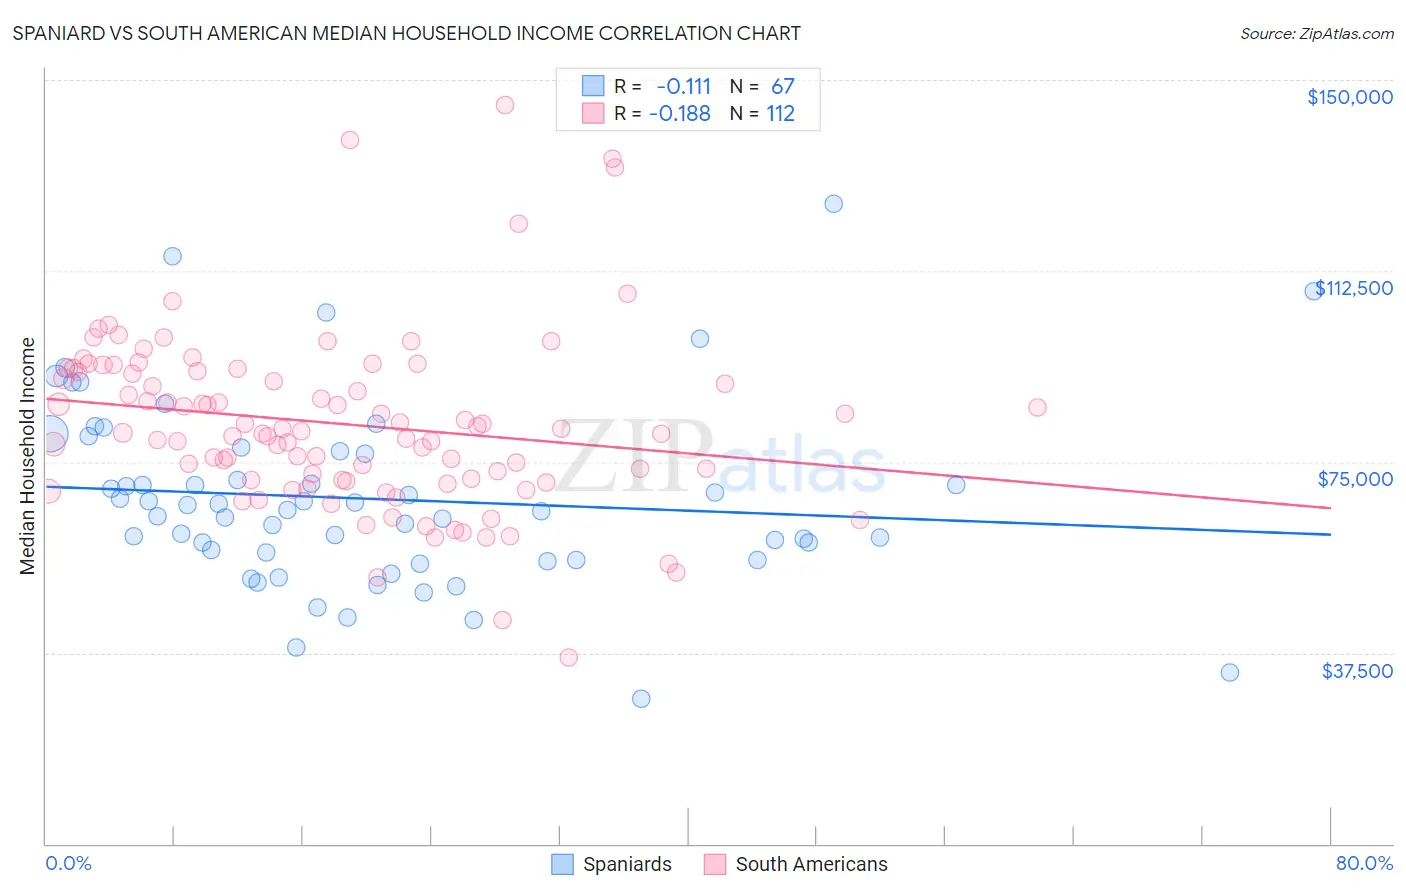
Spaniard vs South American Median Household Income Correlation Chart
The statistical analysis conducted on geographies consisting of 443,014,990 people shows a poor negative correlation between the proportion of Spaniards and median household income in the United States with a correlation coefficient (R) of -0.111 and weighted average of $84,644. Similarly, the statistical analysis conducted on geographies consisting of 493,431,068 people shows a poor negative correlation between the proportion of South Americans and median household income in the United States with a correlation coefficient (R) of -0.188 and weighted average of $86,824, a difference of 2.6%.
Median Household Income Correlation Summary
| Measurement | Spaniard | South American |
| Minimum | $28,571 | $36,563 |
| Maximum | $125,625 | $145,121 |
| Range | $97,054 | $108,558 |
| Mean | $67,731 | $82,451 |
| Median | $65,475 | $80,811 |
| Interquartile 25% (IQ1) | $55,726 | $71,448 |
| Interquartile 75% (IQ3) | $77,042 | $92,775 |
| Interquartile Range (IQR) | $21,316 | $21,327 |
| Standard Deviation (Sample) | $18,232 | $17,445 |
| Standard Deviation (Population) | $18,096 | $17,367 |
Similar Demographics by Median Household Income
Demographics Similar to Spaniards by Median Household Income
In terms of median household income, the demographic groups most similar to Spaniards are Uruguayan ($84,691, a difference of 0.060%), Hawaiian ($84,729, a difference of 0.10%), Immigrants from Portugal ($84,740, a difference of 0.11%), English ($84,915, a difference of 0.32%), and Czechoslovakian ($84,965, a difference of 0.38%).
| Demographics | Rating | Rank | Median Household Income |
| Alsatians | 49.2 /100 | #176 | Average $85,053 |
| Immigrants | Eritrea | 48.8 /100 | #177 | Average $85,025 |
| Czechoslovakians | 47.8 /100 | #178 | Average $84,965 |
| English | 47.0 /100 | #179 | Average $84,915 |
| Immigrants | Portugal | 44.2 /100 | #180 | Average $84,740 |
| Hawaiians | 44.1 /100 | #181 | Average $84,729 |
| Uruguayans | 43.5 /100 | #182 | Average $84,691 |
| Spaniards | 42.7 /100 | #183 | Average $84,644 |
| Immigrants | Eastern Africa | 37.4 /100 | #184 | Fair $84,299 |
| Kenyans | 34.2 /100 | #185 | Fair $84,085 |
| Puget Sound Salish | 33.2 /100 | #186 | Fair $84,011 |
| Belgians | 33.2 /100 | #187 | Fair $84,008 |
| Tlingit-Haida | 32.6 /100 | #188 | Fair $83,968 |
| Immigrants | Colombia | 31.7 /100 | #189 | Fair $83,902 |
| Slovaks | 30.2 /100 | #190 | Fair $83,798 |
Demographics Similar to South Americans by Median Household Income
In terms of median household income, the demographic groups most similar to South Americans are Immigrants from Saudi Arabia ($86,875, a difference of 0.060%), Immigrants from Germany ($86,764, a difference of 0.070%), Hungarian ($86,920, a difference of 0.11%), Basque ($87,001, a difference of 0.20%), and Carpatho Rusyn ($86,635, a difference of 0.22%).
| Demographics | Rating | Rank | Median Household Income |
| Immigrants | Uganda | 82.8 /100 | #146 | Excellent $87,553 |
| South American Indians | 81.8 /100 | #147 | Excellent $87,446 |
| Costa Ricans | 80.0 /100 | #148 | Excellent $87,262 |
| Immigrants | Nepal | 77.7 /100 | #149 | Good $87,046 |
| Basques | 77.2 /100 | #150 | Good $87,001 |
| Hungarians | 76.3 /100 | #151 | Good $86,920 |
| Immigrants | Saudi Arabia | 75.8 /100 | #152 | Good $86,875 |
| South Americans | 75.1 /100 | #153 | Good $86,824 |
| Immigrants | Germany | 74.4 /100 | #154 | Good $86,764 |
| Carpatho Rusyns | 72.8 /100 | #155 | Good $86,635 |
| Immigrants | Albania | 71.5 /100 | #156 | Good $86,534 |
| Samoans | 71.0 /100 | #157 | Good $86,498 |
| Moroccans | 70.6 /100 | #158 | Good $86,468 |
| Immigrants | Uzbekistan | 70.1 /100 | #159 | Good $86,425 |
| Luxembourgers | 70.0 /100 | #160 | Good $86,418 |