Spaniard vs Immigrants from Grenada Unemployment Among Women with Children Under 6 years
COMPARE
Spaniard
Immigrants from Grenada
Unemployment Among Women with Children Under 6 years
Unemployment Among Women with Children Under 6 years Comparison
Spaniards
Immigrants from Grenada
7.8%
UNEMPLOYMENT AMONG WOMEN WITH CHILDREN UNDER 6 YEARS
23.3/ 100
METRIC RATING
203rd/ 347
METRIC RANK
7.6%
UNEMPLOYMENT AMONG WOMEN WITH CHILDREN UNDER 6 YEARS
59.0/ 100
METRIC RATING
171st/ 347
METRIC RANK
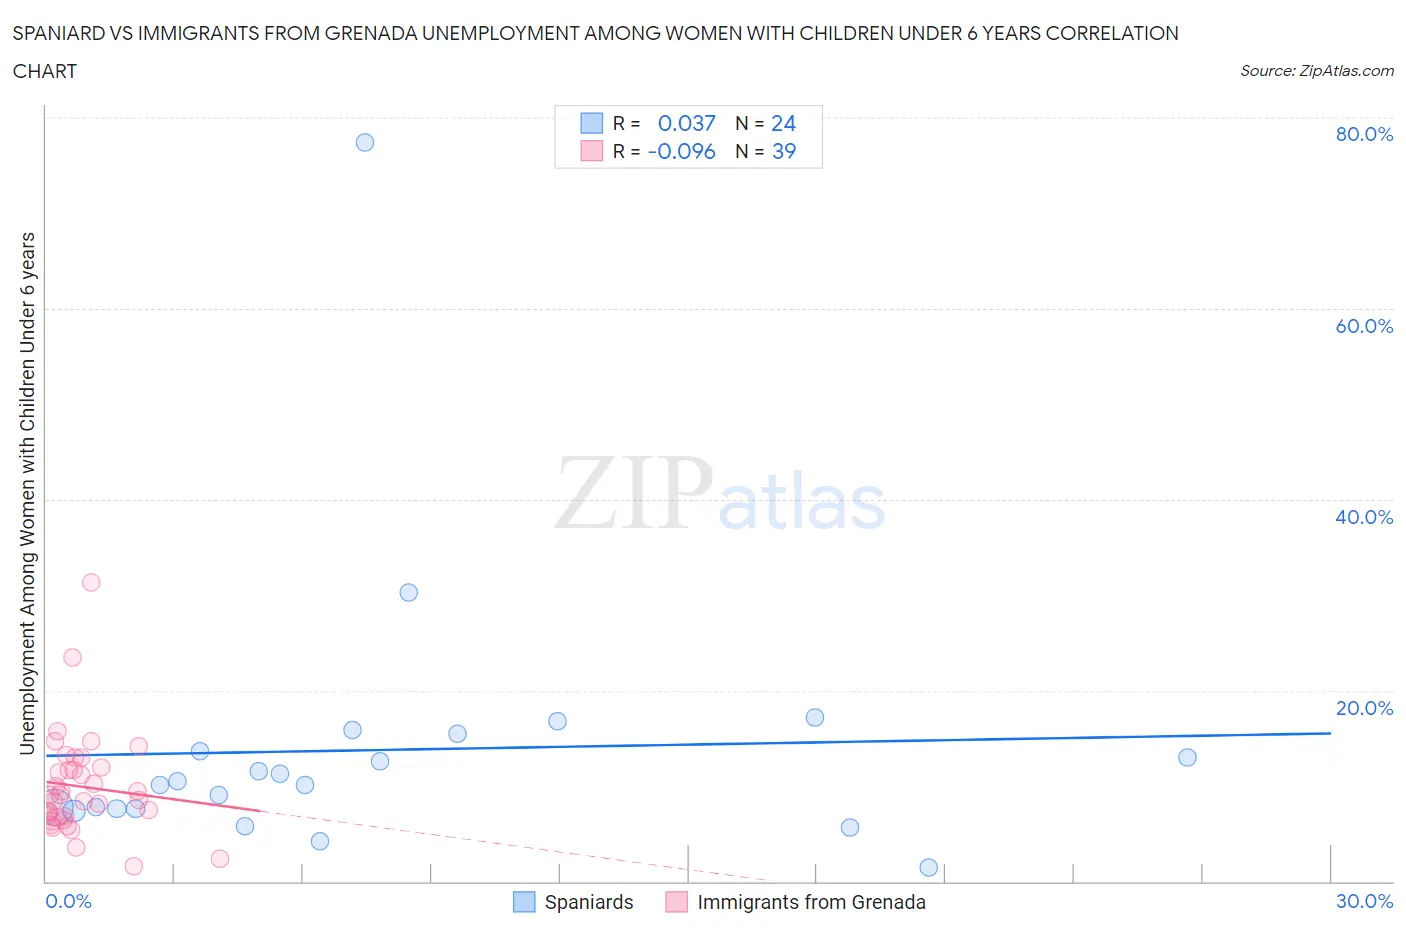
Spaniard vs Immigrants from Grenada Unemployment Among Women with Children Under 6 years Correlation Chart
The statistical analysis conducted on geographies consisting of 330,047,917 people shows no correlation between the proportion of Spaniards and unemployment rate among women with children under the age of 6 in the United States with a correlation coefficient (R) of 0.037 and weighted average of 7.8%. Similarly, the statistical analysis conducted on geographies consisting of 61,595,410 people shows a slight negative correlation between the proportion of Immigrants from Grenada and unemployment rate among women with children under the age of 6 in the United States with a correlation coefficient (R) of -0.096 and weighted average of 7.6%, a difference of 2.6%.
Unemployment Among Women with Children Under 6 years Correlation Summary
| Measurement | Spaniard | Immigrants from Grenada |
| Minimum | 1.5% | 1.6% |
| Maximum | 77.4% | 31.3% |
| Range | 75.9% | 29.7% |
| Mean | 13.7% | 9.9% |
| Median | 10.3% | 9.0% |
| Interquartile 25% (IQ1) | 7.6% | 6.7% |
| Interquartile 75% (IQ3) | 14.5% | 11.9% |
| Interquartile Range (IQR) | 6.9% | 5.2% |
| Standard Deviation (Sample) | 14.7% | 5.4% |
| Standard Deviation (Population) | 14.4% | 5.3% |
Similar Demographics by Unemployment Among Women with Children Under 6 years
Demographics Similar to Spaniards by Unemployment Among Women with Children Under 6 years
In terms of unemployment among women with children under 6 years, the demographic groups most similar to Spaniards are Sudanese (7.8%, a difference of 0.010%), Lebanese (7.8%, a difference of 0.11%), Basque (7.8%, a difference of 0.12%), Immigrants (7.8%, a difference of 0.18%), and Guamanian/Chamorro (7.8%, a difference of 0.19%).
| Demographics | Rating | Rank | Unemployment Among Women with Children Under 6 years |
| Immigrants | St. Vincent and the Grenadines | 31.1 /100 | #196 | Fair 7.7% |
| Italians | 30.4 /100 | #197 | Fair 7.7% |
| Lithuanians | 30.0 /100 | #198 | Fair 7.8% |
| Immigrants | Poland | 27.3 /100 | #199 | Fair 7.8% |
| Guamanians/Chamorros | 25.5 /100 | #200 | Fair 7.8% |
| Basques | 24.7 /100 | #201 | Fair 7.8% |
| Sudanese | 23.5 /100 | #202 | Fair 7.8% |
| Spaniards | 23.3 /100 | #203 | Fair 7.8% |
| Lebanese | 22.2 /100 | #204 | Fair 7.8% |
| Immigrants | Immigrants | 21.4 /100 | #205 | Fair 7.8% |
| Hungarians | 21.2 /100 | #206 | Fair 7.8% |
| Canadians | 20.6 /100 | #207 | Fair 7.8% |
| Immigrants | Syria | 18.9 /100 | #208 | Poor 7.8% |
| Costa Ricans | 17.6 /100 | #209 | Poor 7.8% |
| Poles | 16.0 /100 | #210 | Poor 7.9% |
Demographics Similar to Immigrants from Grenada by Unemployment Among Women with Children Under 6 years
In terms of unemployment among women with children under 6 years, the demographic groups most similar to Immigrants from Grenada are Czech (7.6%, a difference of 0.060%), Immigrants from North America (7.6%, a difference of 0.090%), Immigrants from Scotland (7.6%, a difference of 0.16%), Immigrants from Canada (7.6%, a difference of 0.18%), and Kenyan (7.6%, a difference of 0.25%).
| Demographics | Rating | Rank | Unemployment Among Women with Children Under 6 years |
| Ugandans | 65.8 /100 | #164 | Good 7.6% |
| Immigrants | South America | 65.6 /100 | #165 | Good 7.6% |
| Belgians | 63.5 /100 | #166 | Good 7.6% |
| Kenyans | 62.5 /100 | #167 | Good 7.6% |
| Immigrants | Canada | 61.6 /100 | #168 | Good 7.6% |
| Immigrants | Scotland | 61.3 /100 | #169 | Good 7.6% |
| Czechs | 59.8 /100 | #170 | Average 7.6% |
| Immigrants | Grenada | 59.0 /100 | #171 | Average 7.6% |
| Immigrants | North America | 57.7 /100 | #172 | Average 7.6% |
| Cree | 51.6 /100 | #173 | Average 7.6% |
| Immigrants | Laos | 50.0 /100 | #174 | Average 7.6% |
| Panamanians | 49.6 /100 | #175 | Average 7.6% |
| Puget Sound Salish | 47.7 /100 | #176 | Average 7.7% |
| Austrians | 46.0 /100 | #177 | Average 7.7% |
| Immigrants | England | 45.4 /100 | #178 | Average 7.7% |