Spaniard vs Immigrants from Grenada Disability Age 5 to 17
COMPARE
Spaniard
Immigrants from Grenada
Disability Age 5 to 17
Disability Age 5 to 17 Comparison
Spaniards
Immigrants from Grenada
5.9%
DISABILITY AGE 5 TO 17
2.0/ 100
METRIC RATING
242nd/ 347
METRIC RANK
5.3%
DISABILITY AGE 5 TO 17
99.1/ 100
METRIC RATING
95th/ 347
METRIC RANK
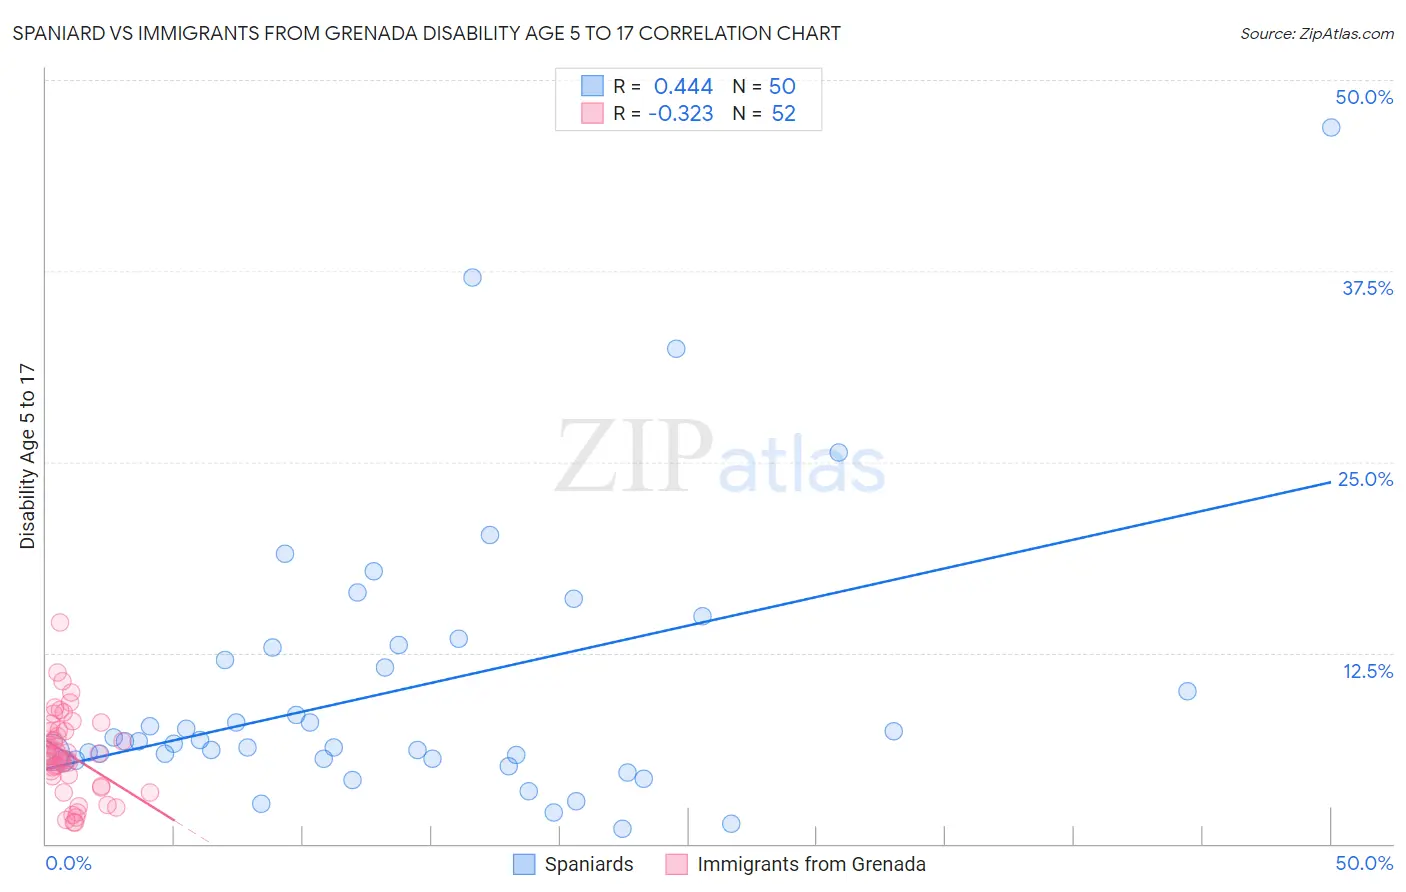
Spaniard vs Immigrants from Grenada Disability Age 5 to 17 Correlation Chart
The statistical analysis conducted on geographies consisting of 438,849,773 people shows a moderate positive correlation between the proportion of Spaniards and percentage of population with a disability between the ages 5 and 17 in the United States with a correlation coefficient (R) of 0.444 and weighted average of 5.9%. Similarly, the statistical analysis conducted on geographies consisting of 67,127,267 people shows a mild negative correlation between the proportion of Immigrants from Grenada and percentage of population with a disability between the ages 5 and 17 in the United States with a correlation coefficient (R) of -0.323 and weighted average of 5.3%, a difference of 11.2%.
Disability Age 5 to 17 Correlation Summary
| Measurement | Spaniard | Immigrants from Grenada |
| Minimum | 0.99% | 1.4% |
| Maximum | 46.9% | 14.5% |
| Range | 45.9% | 13.2% |
| Mean | 10.2% | 5.9% |
| Median | 6.7% | 5.8% |
| Interquartile 25% (IQ1) | 5.6% | 4.1% |
| Interquartile 75% (IQ3) | 12.9% | 7.4% |
| Interquartile Range (IQR) | 7.3% | 3.3% |
| Standard Deviation (Sample) | 9.0% | 2.7% |
| Standard Deviation (Population) | 9.0% | 2.7% |
Similar Demographics by Disability Age 5 to 17
Demographics Similar to Spaniards by Disability Age 5 to 17
In terms of disability age 5 to 17, the demographic groups most similar to Spaniards are Indonesian (5.9%, a difference of 0.010%), Immigrants from Germany (5.9%, a difference of 0.070%), Immigrants from Micronesia (5.9%, a difference of 0.070%), Immigrants from Caribbean (5.9%, a difference of 0.080%), and Tlingit-Haida (5.9%, a difference of 0.080%).
| Demographics | Rating | Rank | Disability Age 5 to 17 |
| Malaysians | 3.4 /100 | #235 | Tragic 5.8% |
| Immigrants | Brazil | 3.2 /100 | #236 | Tragic 5.8% |
| Sudanese | 2.9 /100 | #237 | Tragic 5.8% |
| Hungarians | 2.6 /100 | #238 | Tragic 5.8% |
| German Russians | 2.4 /100 | #239 | Tragic 5.9% |
| West Indians | 2.4 /100 | #240 | Tragic 5.9% |
| Immigrants | Caribbean | 2.1 /100 | #241 | Tragic 5.9% |
| Spaniards | 2.0 /100 | #242 | Tragic 5.9% |
| Indonesians | 2.0 /100 | #243 | Tragic 5.9% |
| Immigrants | Germany | 1.9 /100 | #244 | Tragic 5.9% |
| Immigrants | Micronesia | 1.9 /100 | #245 | Tragic 5.9% |
| Tlingit-Haida | 1.9 /100 | #246 | Tragic 5.9% |
| Immigrants | Honduras | 1.8 /100 | #247 | Tragic 5.9% |
| British | 1.7 /100 | #248 | Tragic 5.9% |
| Immigrants | Ghana | 1.7 /100 | #249 | Tragic 5.9% |
Demographics Similar to Immigrants from Grenada by Disability Age 5 to 17
In terms of disability age 5 to 17, the demographic groups most similar to Immigrants from Grenada are Immigrants from Jordan (5.3%, a difference of 0.020%), Immigrants from Peru (5.3%, a difference of 0.090%), Luxembourger (5.3%, a difference of 0.16%), Immigrants from El Salvador (5.3%, a difference of 0.16%), and Immigrants from Europe (5.3%, a difference of 0.16%).
| Demographics | Rating | Rank | Disability Age 5 to 17 |
| Immigrants | Croatia | 99.4 /100 | #88 | Exceptional 5.2% |
| Immigrants | Spain | 99.4 /100 | #89 | Exceptional 5.2% |
| Immigrants | Kuwait | 99.4 /100 | #90 | Exceptional 5.3% |
| Mongolians | 99.2 /100 | #91 | Exceptional 5.3% |
| Luxembourgers | 99.2 /100 | #92 | Exceptional 5.3% |
| Immigrants | Peru | 99.1 /100 | #93 | Exceptional 5.3% |
| Immigrants | Jordan | 99.1 /100 | #94 | Exceptional 5.3% |
| Immigrants | Grenada | 99.1 /100 | #95 | Exceptional 5.3% |
| Immigrants | El Salvador | 99.0 /100 | #96 | Exceptional 5.3% |
| Immigrants | Europe | 99.0 /100 | #97 | Exceptional 5.3% |
| Immigrants | Austria | 98.9 /100 | #98 | Exceptional 5.3% |
| Cambodians | 98.8 /100 | #99 | Exceptional 5.3% |
| Nepalese | 98.7 /100 | #100 | Exceptional 5.3% |
| Menominee | 98.7 /100 | #101 | Exceptional 5.3% |
| Nicaraguans | 98.6 /100 | #102 | Exceptional 5.3% |