Spaniard vs Cuban Unemployment Among Women with Children Under 6 years
COMPARE
Spaniard
Cuban
Unemployment Among Women with Children Under 6 years
Unemployment Among Women with Children Under 6 years Comparison
Spaniards
Cubans
7.8%
UNEMPLOYMENT AMONG WOMEN WITH CHILDREN UNDER 6 YEARS
23.3/ 100
METRIC RATING
203rd/ 347
METRIC RANK
7.0%
UNEMPLOYMENT AMONG WOMEN WITH CHILDREN UNDER 6 YEARS
99.4/ 100
METRIC RATING
72nd/ 347
METRIC RANK
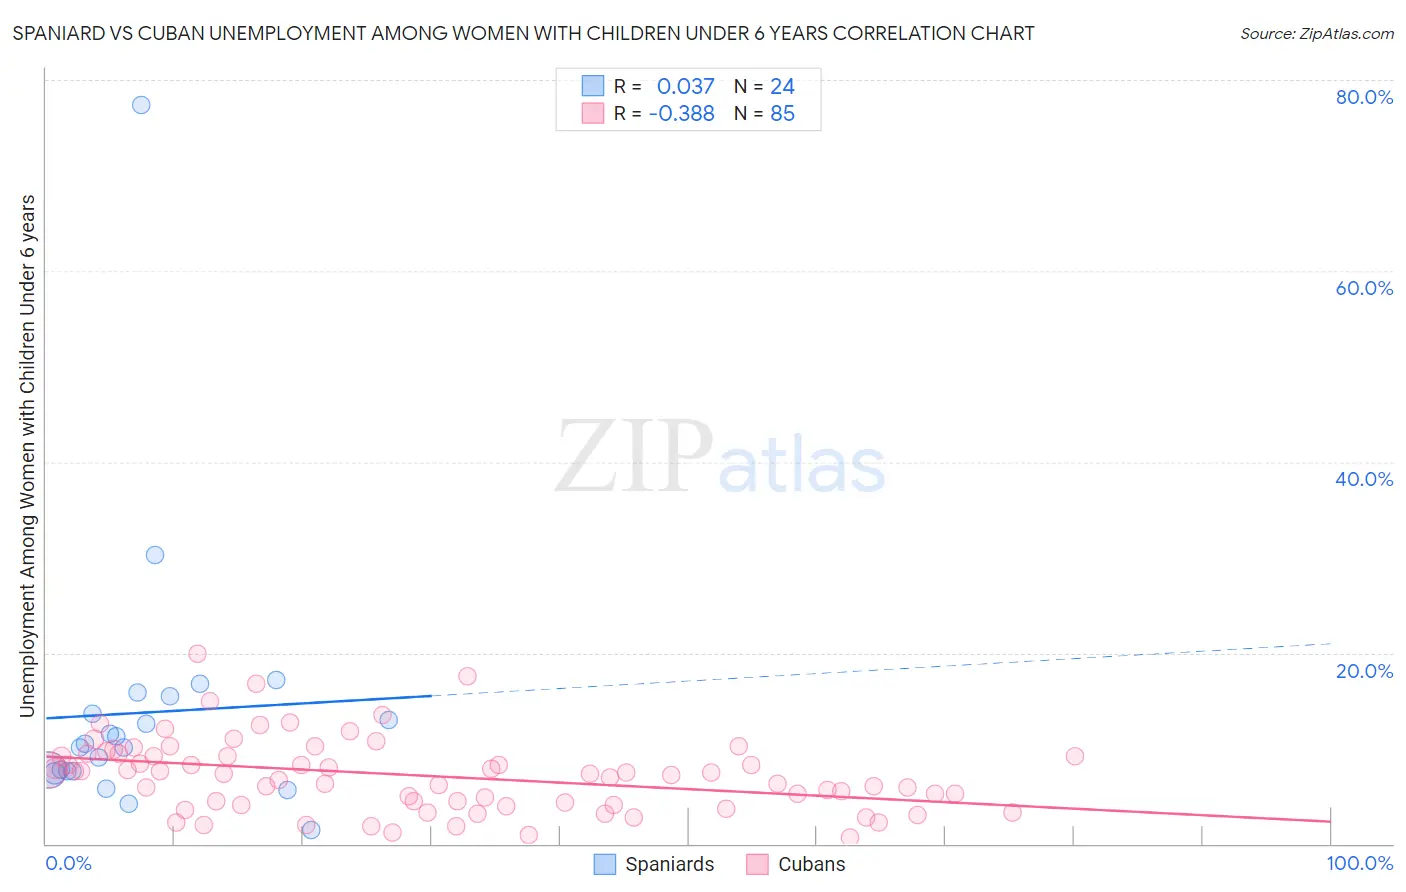
Spaniard vs Cuban Unemployment Among Women with Children Under 6 years Correlation Chart
The statistical analysis conducted on geographies consisting of 330,047,917 people shows no correlation between the proportion of Spaniards and unemployment rate among women with children under the age of 6 in the United States with a correlation coefficient (R) of 0.037 and weighted average of 7.8%. Similarly, the statistical analysis conducted on geographies consisting of 334,950,414 people shows a mild negative correlation between the proportion of Cubans and unemployment rate among women with children under the age of 6 in the United States with a correlation coefficient (R) of -0.388 and weighted average of 7.0%, a difference of 11.4%.
Unemployment Among Women with Children Under 6 years Correlation Summary
| Measurement | Spaniard | Cuban |
| Minimum | 1.5% | 0.70% |
| Maximum | 77.4% | 19.8% |
| Range | 75.9% | 19.1% |
| Mean | 13.7% | 7.1% |
| Median | 10.3% | 7.3% |
| Interquartile 25% (IQ1) | 7.6% | 4.2% |
| Interquartile 75% (IQ3) | 14.5% | 9.3% |
| Interquartile Range (IQR) | 6.9% | 5.1% |
| Standard Deviation (Sample) | 14.7% | 3.8% |
| Standard Deviation (Population) | 14.4% | 3.8% |
Similar Demographics by Unemployment Among Women with Children Under 6 years
Demographics Similar to Spaniards by Unemployment Among Women with Children Under 6 years
In terms of unemployment among women with children under 6 years, the demographic groups most similar to Spaniards are Sudanese (7.8%, a difference of 0.010%), Lebanese (7.8%, a difference of 0.11%), Basque (7.8%, a difference of 0.12%), Immigrants (7.8%, a difference of 0.18%), and Guamanian/Chamorro (7.8%, a difference of 0.19%).
| Demographics | Rating | Rank | Unemployment Among Women with Children Under 6 years |
| Immigrants | St. Vincent and the Grenadines | 31.1 /100 | #196 | Fair 7.7% |
| Italians | 30.4 /100 | #197 | Fair 7.7% |
| Lithuanians | 30.0 /100 | #198 | Fair 7.8% |
| Immigrants | Poland | 27.3 /100 | #199 | Fair 7.8% |
| Guamanians/Chamorros | 25.5 /100 | #200 | Fair 7.8% |
| Basques | 24.7 /100 | #201 | Fair 7.8% |
| Sudanese | 23.5 /100 | #202 | Fair 7.8% |
| Spaniards | 23.3 /100 | #203 | Fair 7.8% |
| Lebanese | 22.2 /100 | #204 | Fair 7.8% |
| Immigrants | Immigrants | 21.4 /100 | #205 | Fair 7.8% |
| Hungarians | 21.2 /100 | #206 | Fair 7.8% |
| Canadians | 20.6 /100 | #207 | Fair 7.8% |
| Immigrants | Syria | 18.9 /100 | #208 | Poor 7.8% |
| Costa Ricans | 17.6 /100 | #209 | Poor 7.8% |
| Poles | 16.0 /100 | #210 | Poor 7.9% |
Demographics Similar to Cubans by Unemployment Among Women with Children Under 6 years
In terms of unemployment among women with children under 6 years, the demographic groups most similar to Cubans are Afghan (7.0%, a difference of 0.11%), Immigrants from Iraq (7.0%, a difference of 0.13%), Immigrants from Eritrea (7.0%, a difference of 0.14%), Paraguayan (7.0%, a difference of 0.18%), and Immigrants from Netherlands (7.0%, a difference of 0.40%).
| Demographics | Rating | Rank | Unemployment Among Women with Children Under 6 years |
| Immigrants | Kuwait | 99.7 /100 | #65 | Exceptional 6.9% |
| Immigrants | Belgium | 99.6 /100 | #66 | Exceptional 6.9% |
| Immigrants | Netherlands | 99.5 /100 | #67 | Exceptional 7.0% |
| Paraguayans | 99.4 /100 | #68 | Exceptional 7.0% |
| Immigrants | Eritrea | 99.4 /100 | #69 | Exceptional 7.0% |
| Immigrants | Iraq | 99.4 /100 | #70 | Exceptional 7.0% |
| Afghans | 99.4 /100 | #71 | Exceptional 7.0% |
| Cubans | 99.4 /100 | #72 | Exceptional 7.0% |
| Immigrants | Czechoslovakia | 99.2 /100 | #73 | Exceptional 7.0% |
| Turks | 99.2 /100 | #74 | Exceptional 7.0% |
| Immigrants | Eastern Europe | 99.0 /100 | #75 | Exceptional 7.1% |
| Estonians | 99.0 /100 | #76 | Exceptional 7.1% |
| Immigrants | Croatia | 98.9 /100 | #77 | Exceptional 7.1% |
| Immigrants | Somalia | 98.9 /100 | #78 | Exceptional 7.1% |
| Immigrants | Fiji | 98.9 /100 | #79 | Exceptional 7.1% |