Immigrants from South Central Asia vs Cuban Median Female Earnings
COMPARE
Immigrants from South Central Asia
Cuban
Median Female Earnings
Median Female Earnings Comparison
Immigrants from South Central Asia
Cubans
$46,324
MEDIAN FEMALE EARNINGS
100.0/ 100
METRIC RATING
17th/ 347
METRIC RANK
$34,942
MEDIAN FEMALE EARNINGS
0.0/ 100
METRIC RATING
313th/ 347
METRIC RANK
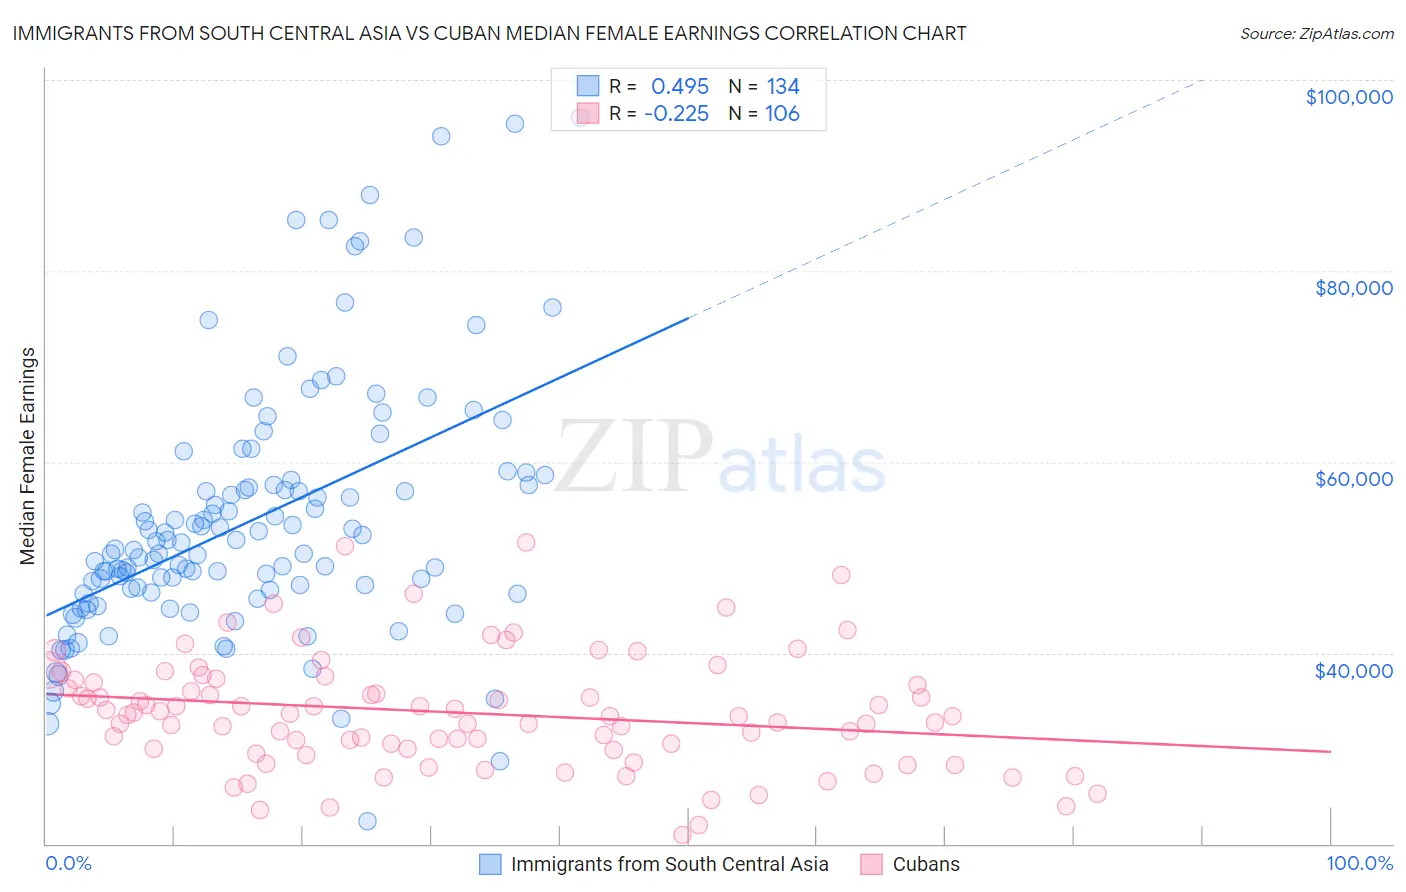
Immigrants from South Central Asia vs Cuban Median Female Earnings Correlation Chart
The statistical analysis conducted on geographies consisting of 472,846,107 people shows a moderate positive correlation between the proportion of Immigrants from South Central Asia and median female earnings in the United States with a correlation coefficient (R) of 0.495 and weighted average of $46,324. Similarly, the statistical analysis conducted on geographies consisting of 449,056,362 people shows a weak negative correlation between the proportion of Cubans and median female earnings in the United States with a correlation coefficient (R) of -0.225 and weighted average of $34,942, a difference of 32.6%.
Median Female Earnings Correlation Summary
| Measurement | Immigrants from South Central Asia | Cuban |
| Minimum | $22,315 | $20,938 |
| Maximum | $96,063 | $51,542 |
| Range | $73,748 | $30,604 |
| Mean | $53,795 | $33,741 |
| Median | $50,791 | $33,424 |
| Interquartile 25% (IQ1) | $46,294 | $29,890 |
| Interquartile 75% (IQ3) | $57,561 | $37,174 |
| Interquartile Range (IQR) | $11,267 | $7,284 |
| Standard Deviation (Sample) | $13,229 | $5,986 |
| Standard Deviation (Population) | $13,180 | $5,958 |
Similar Demographics by Median Female Earnings
Demographics Similar to Immigrants from South Central Asia by Median Female Earnings
In terms of median female earnings, the demographic groups most similar to Immigrants from South Central Asia are Indian (Asian) ($46,481, a difference of 0.34%), Immigrants from Eastern Asia ($46,502, a difference of 0.39%), Soviet Union ($46,556, a difference of 0.50%), Immigrants from Australia ($46,573, a difference of 0.54%), and Immigrants from Israel ($46,902, a difference of 1.3%).
| Demographics | Rating | Rank | Median Female Earnings |
| Immigrants | China | 100.0 /100 | #10 | Exceptional $46,972 |
| Okinawans | 100.0 /100 | #11 | Exceptional $46,905 |
| Immigrants | Israel | 100.0 /100 | #12 | Exceptional $46,902 |
| Immigrants | Australia | 100.0 /100 | #13 | Exceptional $46,573 |
| Soviet Union | 100.0 /100 | #14 | Exceptional $46,556 |
| Immigrants | Eastern Asia | 100.0 /100 | #15 | Exceptional $46,502 |
| Indians (Asian) | 100.0 /100 | #16 | Exceptional $46,481 |
| Immigrants | South Central Asia | 100.0 /100 | #17 | Exceptional $46,324 |
| Cypriots | 100.0 /100 | #18 | Exceptional $45,570 |
| Eastern Europeans | 100.0 /100 | #19 | Exceptional $45,385 |
| Immigrants | Japan | 100.0 /100 | #20 | Exceptional $45,323 |
| Cambodians | 100.0 /100 | #21 | Exceptional $45,014 |
| Immigrants | Greece | 100.0 /100 | #22 | Exceptional $44,976 |
| Burmese | 100.0 /100 | #23 | Exceptional $44,911 |
| Immigrants | Korea | 100.0 /100 | #24 | Exceptional $44,847 |
Demographics Similar to Cubans by Median Female Earnings
In terms of median female earnings, the demographic groups most similar to Cubans are Yaqui ($34,943, a difference of 0.0%), Ute ($34,960, a difference of 0.050%), Apache ($34,895, a difference of 0.13%), Chippewa ($35,003, a difference of 0.17%), and Honduran ($35,013, a difference of 0.20%).
| Demographics | Rating | Rank | Median Female Earnings |
| Fijians | 0.0 /100 | #306 | Tragic $35,114 |
| Sioux | 0.0 /100 | #307 | Tragic $35,063 |
| Immigrants | Bahamas | 0.0 /100 | #308 | Tragic $35,027 |
| Hondurans | 0.0 /100 | #309 | Tragic $35,013 |
| Chippewa | 0.0 /100 | #310 | Tragic $35,003 |
| Ute | 0.0 /100 | #311 | Tragic $34,960 |
| Yaqui | 0.0 /100 | #312 | Tragic $34,943 |
| Cubans | 0.0 /100 | #313 | Tragic $34,942 |
| Apache | 0.0 /100 | #314 | Tragic $34,895 |
| Pennsylvania Germans | 0.0 /100 | #315 | Tragic $34,802 |
| Cherokee | 0.0 /100 | #316 | Tragic $34,742 |
| Potawatomi | 0.0 /100 | #317 | Tragic $34,739 |
| Immigrants | Yemen | 0.0 /100 | #318 | Tragic $34,693 |
| Shoshone | 0.0 /100 | #319 | Tragic $34,677 |
| Immigrants | Honduras | 0.0 /100 | #320 | Tragic $34,647 |