Spaniard vs Cuban Hearing Disability
COMPARE
Spaniard
Cuban
Hearing Disability
Hearing Disability Comparison
Spaniards
Cubans
3.5%
HEARING DISABILITY
0.1/ 100
METRIC RATING
268th/ 347
METRIC RANK
2.8%
HEARING DISABILITY
89.4/ 100
METRIC RATING
121st/ 347
METRIC RANK
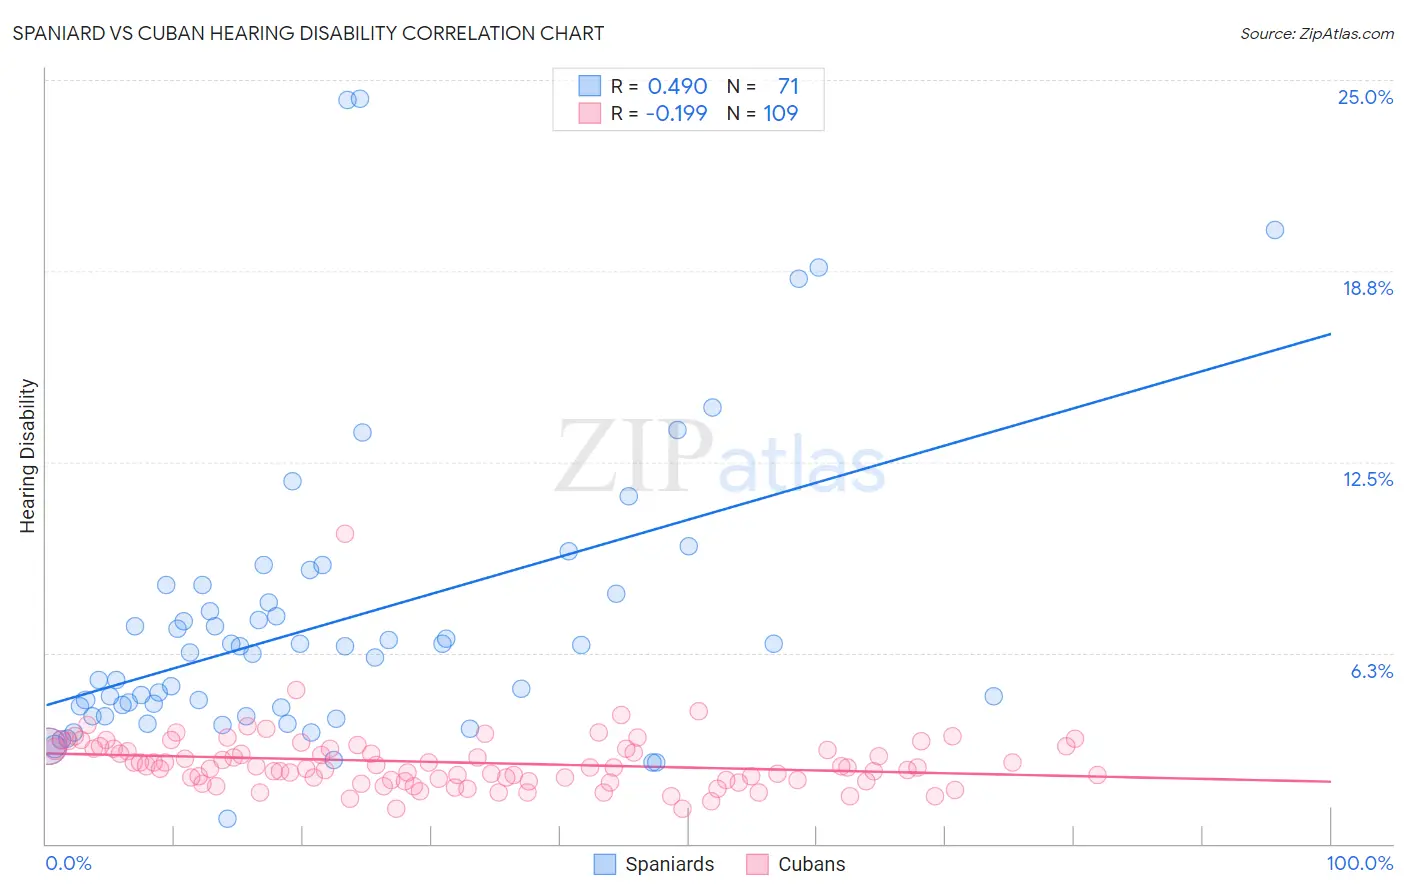
Spaniard vs Cuban Hearing Disability Correlation Chart
The statistical analysis conducted on geographies consisting of 443,274,447 people shows a moderate positive correlation between the proportion of Spaniards and percentage of population with hearing disability in the United States with a correlation coefficient (R) of 0.490 and weighted average of 3.5%. Similarly, the statistical analysis conducted on geographies consisting of 449,105,745 people shows a poor negative correlation between the proportion of Cubans and percentage of population with hearing disability in the United States with a correlation coefficient (R) of -0.199 and weighted average of 2.8%, a difference of 22.6%.
Hearing Disability Correlation Summary
| Measurement | Spaniard | Cuban |
| Minimum | 0.81% | 1.1% |
| Maximum | 24.4% | 10.1% |
| Range | 23.6% | 9.0% |
| Mean | 7.2% | 2.7% |
| Median | 6.2% | 2.5% |
| Interquartile 25% (IQ1) | 4.2% | 2.1% |
| Interquartile 75% (IQ3) | 8.2% | 3.1% |
| Interquartile Range (IQR) | 4.0% | 1.0% |
| Standard Deviation (Sample) | 4.7% | 1.0% |
| Standard Deviation (Population) | 4.7% | 1.0% |
Similar Demographics by Hearing Disability
Demographics Similar to Spaniards by Hearing Disability
In terms of hearing disability, the demographic groups most similar to Spaniards are Canadian (3.5%, a difference of 0.020%), Belgian (3.5%, a difference of 0.24%), Ute (3.5%, a difference of 0.30%), British (3.5%, a difference of 0.42%), and Immigrants from Germany (3.5%, a difference of 0.44%).
| Demographics | Rating | Rank | Hearing Disability |
| Hawaiians | 0.1 /100 | #261 | Tragic 3.5% |
| Immigrants | North America | 0.1 /100 | #262 | Tragic 3.5% |
| Immigrants | Canada | 0.1 /100 | #263 | Tragic 3.5% |
| Immigrants | Germany | 0.1 /100 | #264 | Tragic 3.5% |
| British | 0.1 /100 | #265 | Tragic 3.5% |
| Belgians | 0.1 /100 | #266 | Tragic 3.5% |
| Canadians | 0.1 /100 | #267 | Tragic 3.5% |
| Spaniards | 0.1 /100 | #268 | Tragic 3.5% |
| Ute | 0.1 /100 | #269 | Tragic 3.5% |
| Europeans | 0.1 /100 | #270 | Tragic 3.5% |
| Czechs | 0.1 /100 | #271 | Tragic 3.5% |
| Fijians | 0.0 /100 | #272 | Tragic 3.5% |
| Puerto Ricans | 0.0 /100 | #273 | Tragic 3.5% |
| Swiss | 0.0 /100 | #274 | Tragic 3.5% |
| Czechoslovakians | 0.0 /100 | #275 | Tragic 3.6% |
Demographics Similar to Cubans by Hearing Disability
In terms of hearing disability, the demographic groups most similar to Cubans are Jordanian (2.8%, a difference of 0.030%), Liberian (2.8%, a difference of 0.090%), Kenyan (2.8%, a difference of 0.12%), Zimbabwean (2.8%, a difference of 0.14%), and Immigrants from Liberia (2.8%, a difference of 0.16%).
| Demographics | Rating | Rank | Hearing Disability |
| Cambodians | 91.1 /100 | #114 | Exceptional 2.8% |
| Immigrants | Latin America | 90.5 /100 | #115 | Exceptional 2.8% |
| Immigrants | Immigrants | 90.3 /100 | #116 | Exceptional 2.8% |
| Immigrants | Liberia | 90.0 /100 | #117 | Excellent 2.8% |
| Zimbabweans | 89.9 /100 | #118 | Excellent 2.8% |
| Kenyans | 89.8 /100 | #119 | Excellent 2.8% |
| Jordanians | 89.5 /100 | #120 | Excellent 2.8% |
| Cubans | 89.4 /100 | #121 | Excellent 2.8% |
| Liberians | 89.0 /100 | #122 | Excellent 2.8% |
| Immigrants | Zaire | 88.6 /100 | #123 | Excellent 2.9% |
| Bahamians | 88.6 /100 | #124 | Excellent 2.9% |
| Immigrants | Albania | 88.5 /100 | #125 | Excellent 2.9% |
| Immigrants | Sudan | 87.8 /100 | #126 | Excellent 2.9% |
| South American Indians | 86.9 /100 | #127 | Excellent 2.9% |
| Immigrants | Western Asia | 86.9 /100 | #128 | Excellent 2.9% |